. 2010 Sep;51(3):262-73.
doi: 10.1097/MPG.0b013e3181e1a114.

Role of postnatal acquisition of the intestinal microbiome in the early development of immune function

Affiliations

Role of postnatal acquisition of the intestinal microbiome in the early development of immune function

Reed A Dimmitt et al. J Pediatr Gastroenterol Nutr. 2010 Sep.

Abstract

Objectives: Therapy with broad-spectrum antibiotics is a common practice for premature infants. This treatment can reduce the biodiversity of the fecal microbiota and may be a factor in the cause of necrotizing enterocolitis. In contrast, probiotic treatment of premature infants reduces the incidence of necrotizing enterocolitis. We hypothesized that 1 mechanism for these observations is the influence of bacteria on postnatal development of the mucosal immune system.

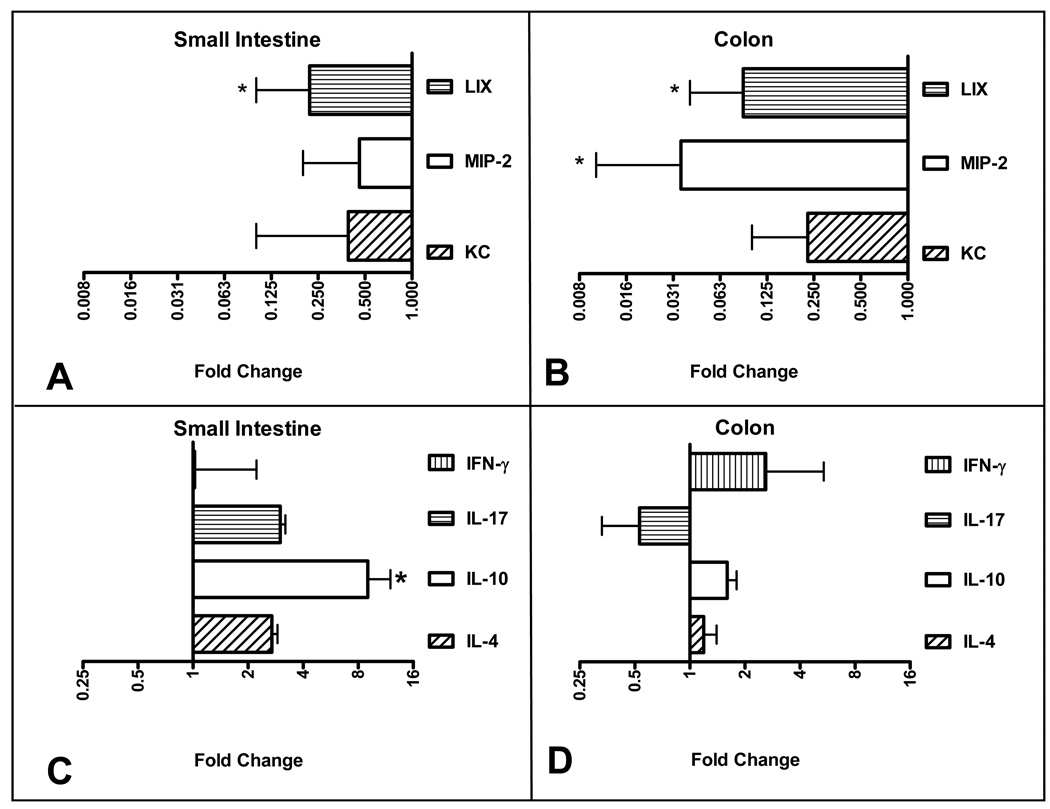
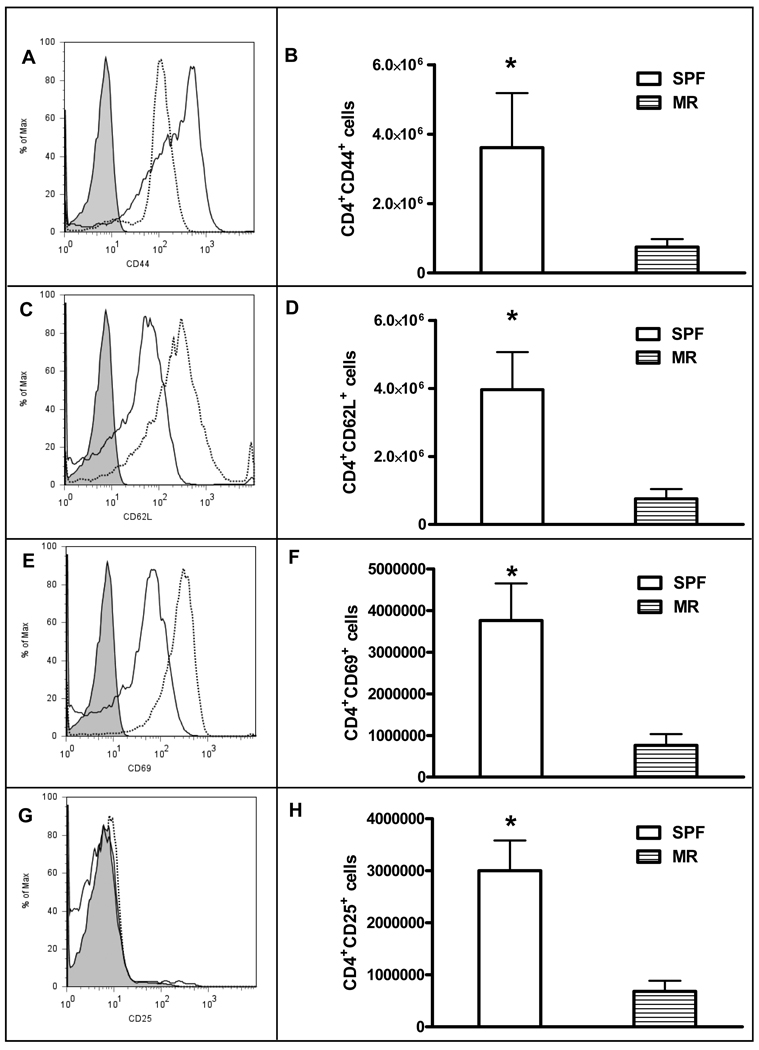
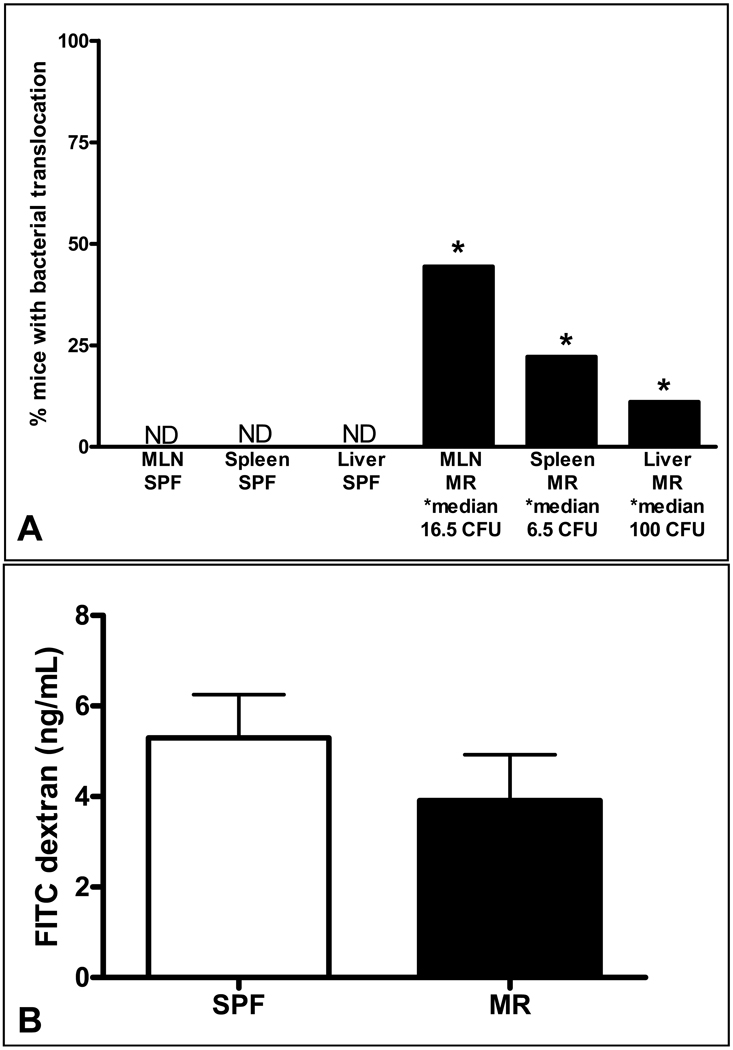
Materials and methods: Expression of immune molecules and microbial sensors was investigated in the postnatal mouse gastrointestinal tract by real-time polymerase chain reaction. Subsequently, 2-week-old specific pathogen-free and microbial-reduced (MR; antibiotic treated) mice were compared for immune molecule and microbial sensor expression, mesenteric lymph node T-cell numbers and activation, intestinal barrier function/permeability, systemic lymphocyte numbers, and T-cell phenotype commitment.

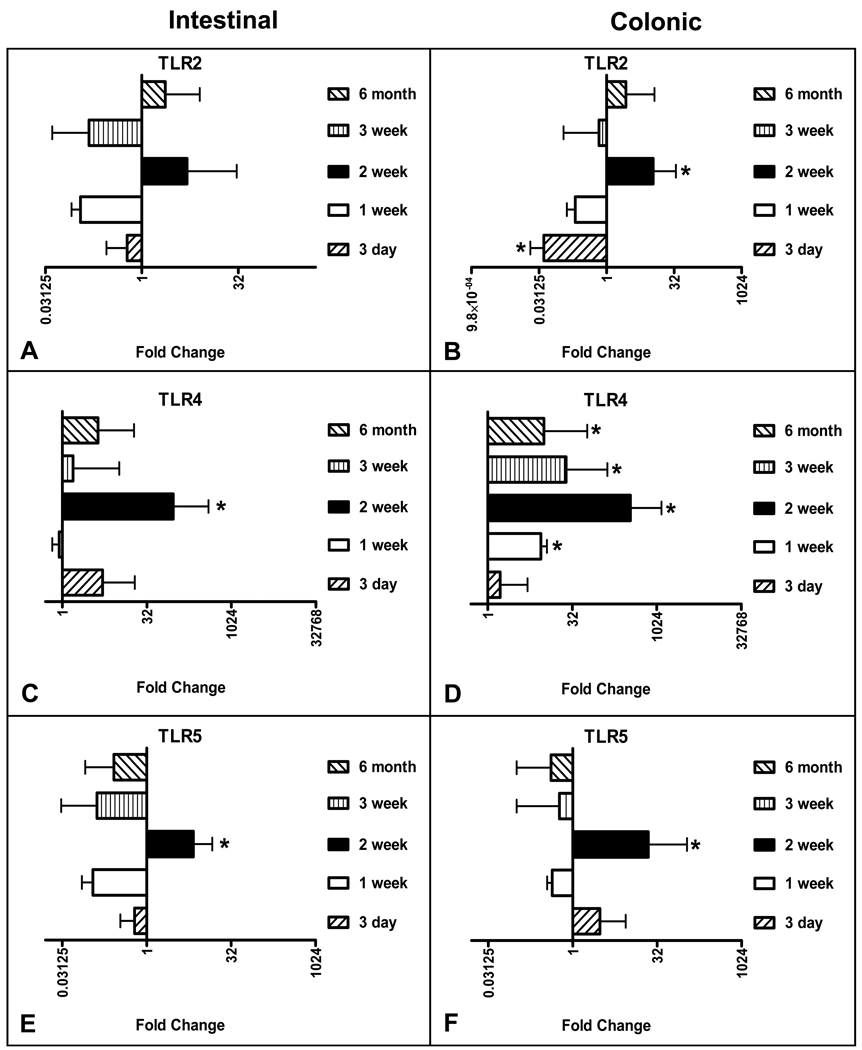
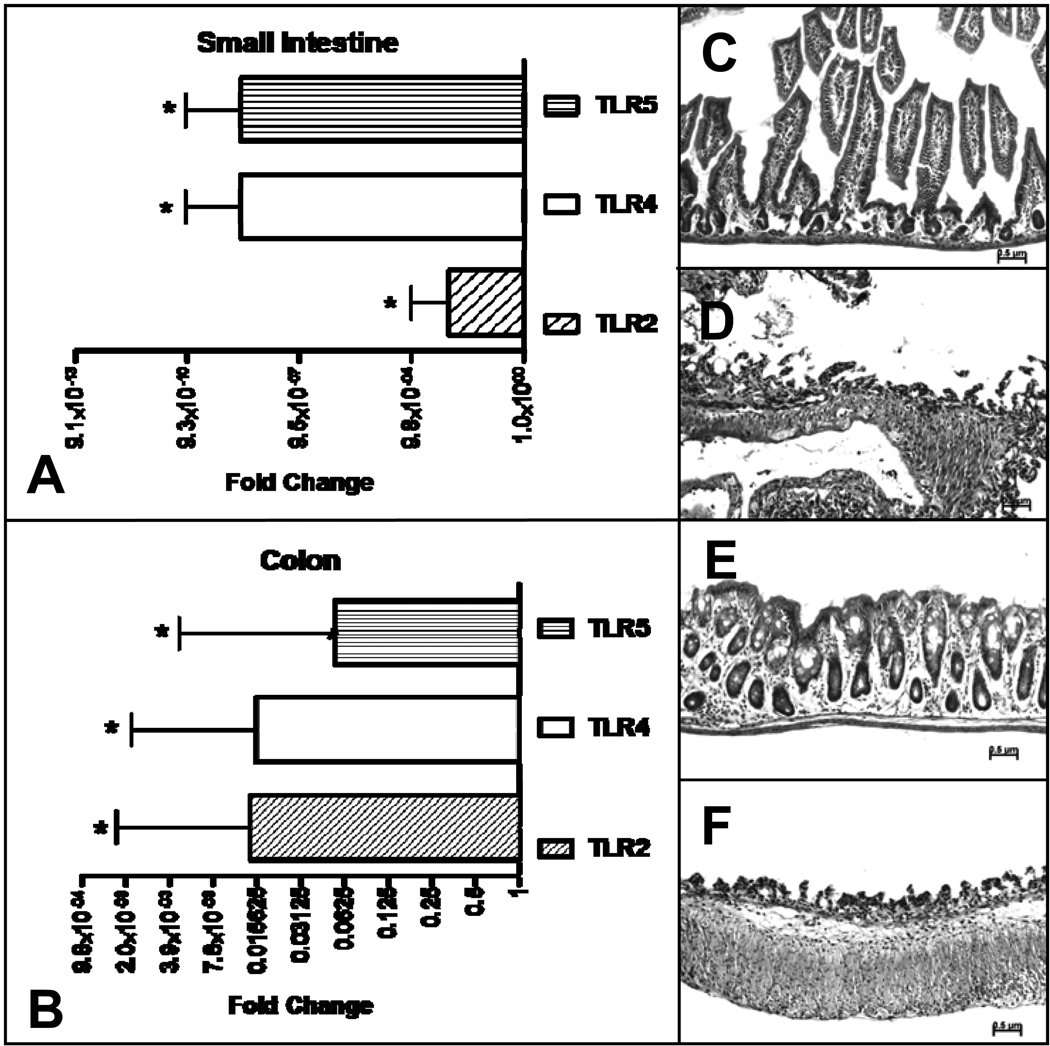
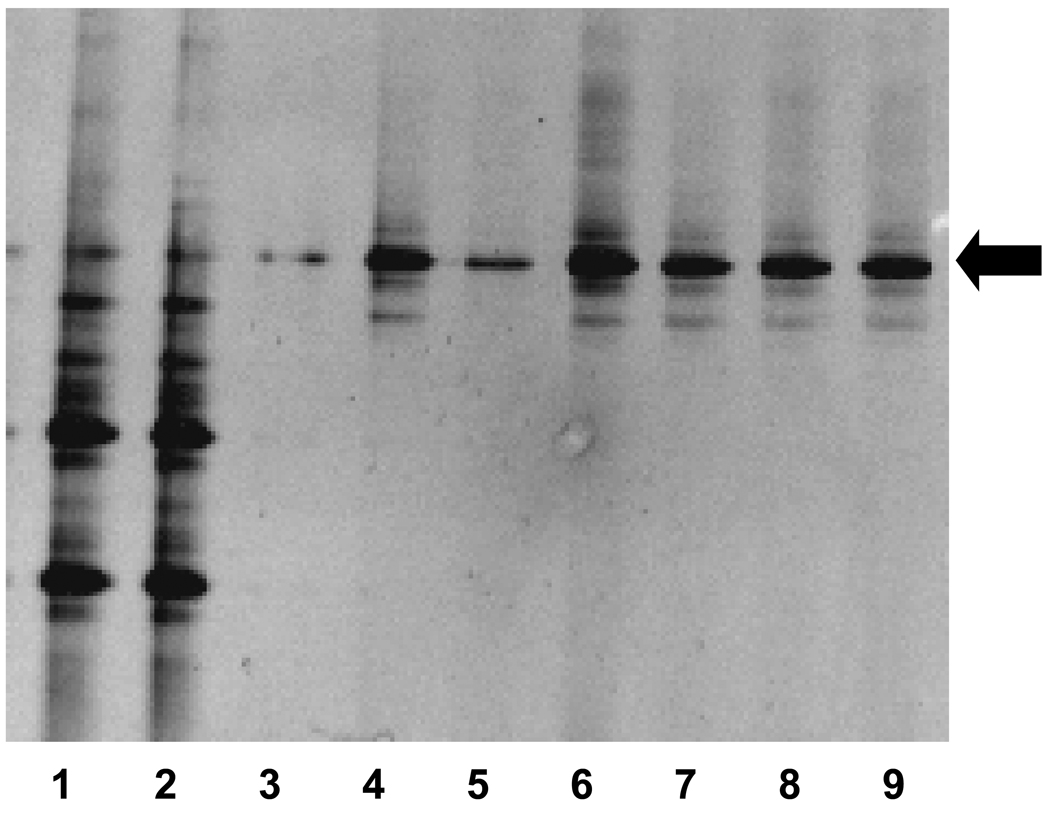
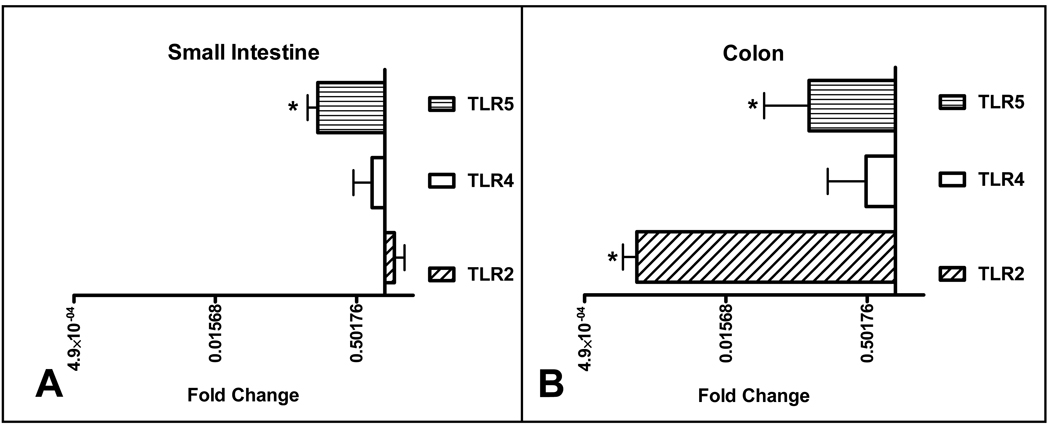
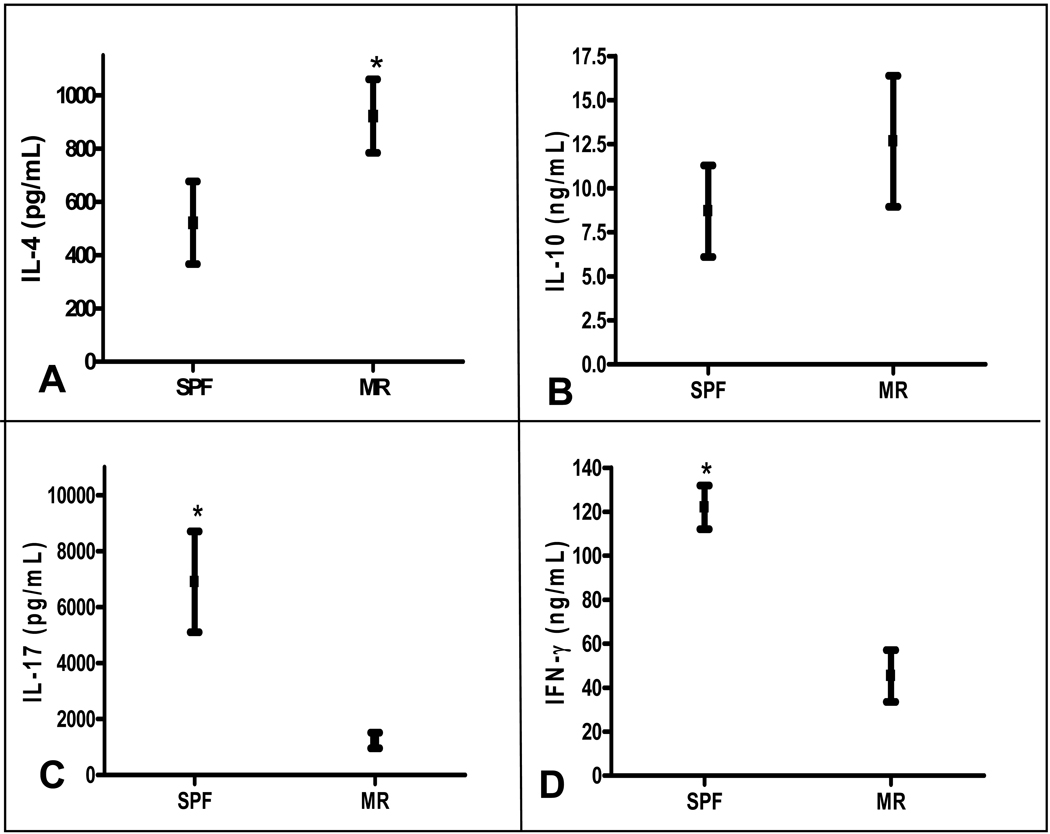
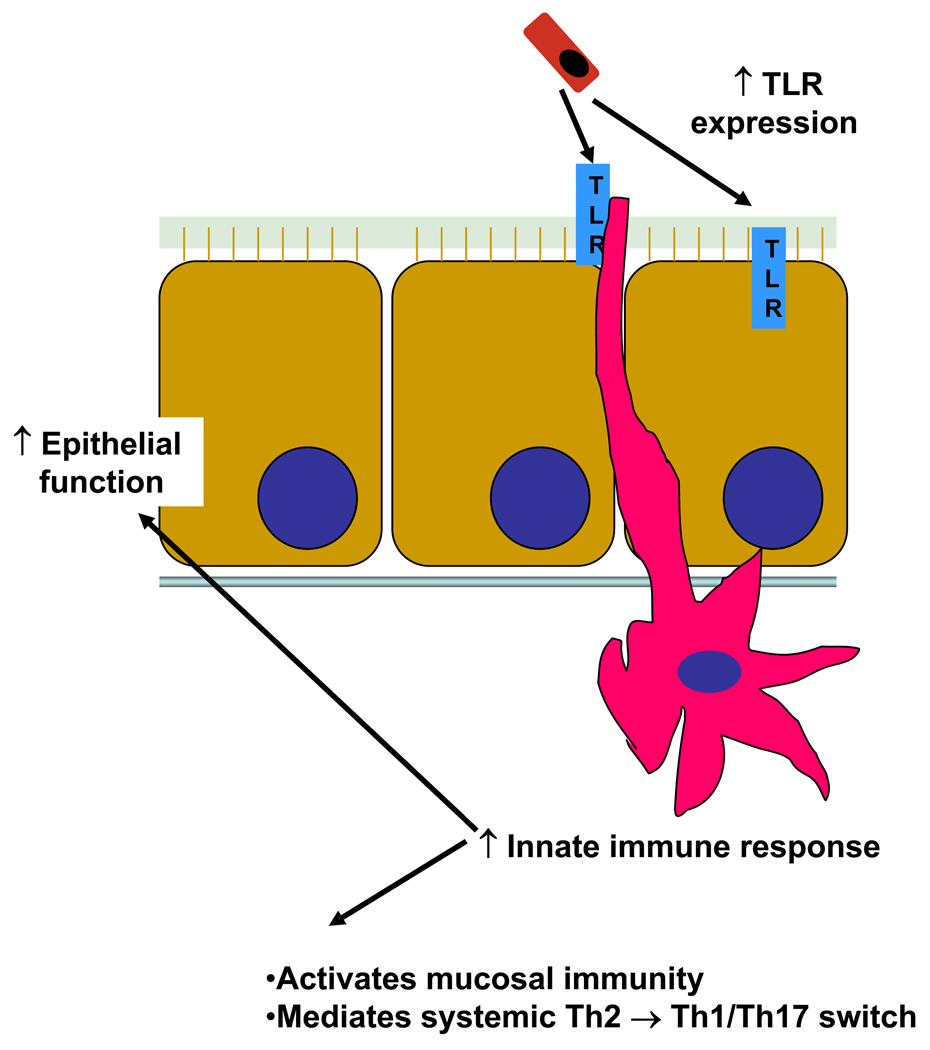
Results: Toll-like receptor 2, 4, and 5 expression was highest in 2-week-old specific pathogen-free mice, and this expression was decreased in MR mice. There was no difference in intestinal tight-junctional function, as evaluated by fluorescein isothiocyanate-dextran uptake, but MR mice had increased bacterial translocation across the intestinal epithelial barrier. MR mice had significantly fewer splenic B cells and mesenteric lymph node CD4+ T cells, but there were normal numbers of splenic T cells. These systemic T cells from MR mice produced more interleukin-4 and less interferon-gamma and IL-17, indicative of maintenance of the fetal, T-helper cell type 2 phenotype.

Conclusions: The present study shows that intestinal commensal microbiota have an influence on early postnatal immune development. Determining specific bacteria and/or bacterial ligands critical for this development could provide insight into the mechanisms by which broad-spectrum antibiotics and/or probiotic therapy influence the development of the mucosal immune system and mucosal-related diseases.


Figures

Figure 1
Figure 1
Quantitative RT-PCR analysis of TLR gene expressin in SPF mice at various postnatal ages. (A) Small intestinal TLR2, (B) colonic TLR2, (C) small intestinal TLR4, (D) colonic TLR4, (E) small intestinal TLR5, (F) colonic TLR5. Data is expressed on a log2 scale and normalized to 18S rRNA expression, with fold change calculated by comparison with the level of expression in E20.5 mice. (E20.5 n=7, Day 3 n=8, Week 1 n=10, Week 2 n=13, Week 3 n=9, Week 6 n=7). The bar graph to the right represents increased expression and to the left decreased expression.
Figure 2
Figure 2
Quantitative RT-PCR analysis of TLR gene expression in SPF mice, comparing epithelial expression to total small intestinal or colonic expression. (A) Small intestinal TLR 2, 4, and 5 expression, (B) colonic TLR 2, 4, and 5 expression, (C) H & E of small intestinal section without and (D) with EDTA digestion. (E) and (F) are similar sections of colon without and with EDTA digestion. RT-PCR data is expressed in log2 scale and normalized to 18S rRNA expression with fold change calculated comparing epithelial expression to total intestinal or colonic expression, n=6. The bar graph to the right represents increased expression and to the left decreased expression.
Figure 3
Figure 3
PCR-DGGE analysis of feces from 2-week-old SPF and MR mice. Lanes 1,2=SPF, lanes 3–9 MR. The black arrow indicates persistent banding pattern observed in the MR mice.
Figure 4
Figure 4
Quantative RT-PCR analysis of TLR gene expression in MR mice compared to SPF. RT-PCR data is expressed in log2 scale and normalized to 18S rRNA expression with fold change calculated comparing MR to SPF. (MR n=10, SPF n=10). The bar graph to the right represents increased expression and to the left decreased expression.
Figure 5
Figure 5
Quantative RT-PCR analysis of cytokine and chemokine expression in MR mice compared to SPF. (A) Small intestinal chemokine expression, (B) colonic chemokine expression, (C) small intestinal cytokine expression, (D) colonic cytokine expression. RT-PCR data is expressed in log2 scale and normalized to 18S rRNA expression with fold change calculated comparing MR to SPF. (MR n=10, SPF n=10). The bar graph to the right represents increased expression and to the left decreased expression.
Figure 6
Figure 6
Flow cytometry analysis of MLN derived T-cell activation markers comparing MR to SPF mice. (A)(C)(E)(G) represent histograms of T-cell surface activation markers CD44, CD62L, CD69, and CD25, respectively. Dotted line=SPF, solid line=MR, gray filled= unlabeled SPF cells. (B)(D)(F)(H) represent absolute numbers of CD4+ cells that are CD44, CD62L, CD69, and CD25 positive. White bars=SPF, stipped bars=MR. Results are 3 separate experiments where the MLNs from 3–5 mice were pooled for analysis. *p<0.05.
Figure 7
Figure 7
Bacterial translocation as a function of intestinal barrier permeability (A). The columns represent the percentage of animals with positive GFP E. coli colonies cultured from mesenteric lymph nodes (MLN), spleen, and liver from SPF (first three columns) and MR (last three columns) neonates. The median number of colony forming units (CFU)/whole organ culture is expressed below the X-axis. ND-none detected, * p< 0.05, (MR n=12, SPF n=11). Epithelial barrier function assay (B). The columns represent serum FITC-dextran concentrations four hours after oral gavage. The concentration is expressed as mean and standard deviation. (MR n=9, SPF=8).
Figure 8
Figure 8
Cytokine ELISA results from MR and SPF splenocyte cultures after αCD3 activation. (A) IL4, (B) IL10, (C) IL17, and (D) IFN-γ. *p<0.05 (MR n=10, SPF n=10).
Figure 9
Figure 9
Proposed mechanism of commensal bacteria acquisition and early postnatal mucosal and immune development.

References

    1. Bäckhed F, Ley R, Sonnenburg J, Peterson D, Gordon J. Host-bacterial mutualism in the human intestine. Science. 2005;307(5717):1915–1920. - PubMed
    1. Hooper L, Midtvedt T, Gordon J. How host-microbial interactions shape the nutrient environment of the mammalian intestine. Annu Rev Nutr. 2002;22:283–307. - PubMed
    1. Ley R, Bäckhed F, Turnbaugh P, Lozupone C, Knight R, Gordon J. Obesity alters gut microbial ecology. Proc Natl Acad Sci U S A. 2005;102(31):11070–11075. - PMC - PubMed
    1. Levy O. Innate immunity of the newborn: basic mechanisms and clinical correlates. Nat Rev Immunol. 2007;7(5):379–390. - PubMed
    1. Trowsdale J, Betz A. Mother's little helpers: mechanisms of maternal-fetal tolerance. Nat Immunol. 2006;7(3):241–246. - PubMed

Publication types

MeSH terms