. 2010 Aug;12(8):739-46.
doi: 10.1038/ncb2087. Epub 2010 Jul 18.

The metabolic enzyme CTP synthase forms cytoskeletal filaments

Affiliations

The metabolic enzyme CTP synthase forms cytoskeletal filaments

Michael Ingerson-Mahar et al. Nat Cell Biol. 2010 Aug.

Abstract

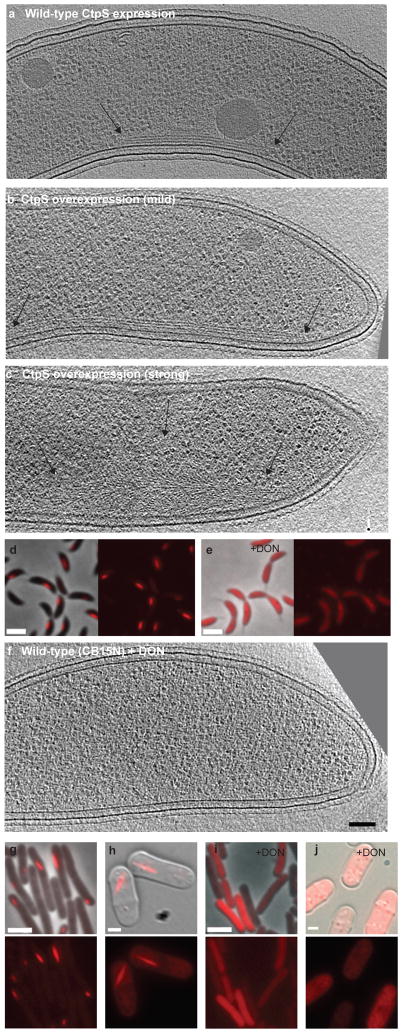
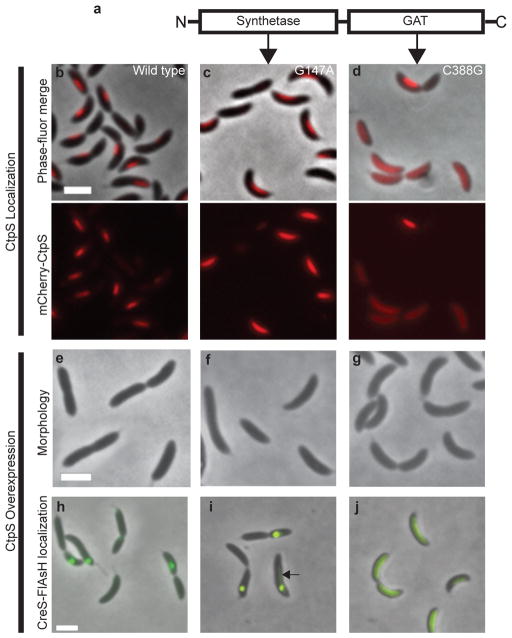
Filament-forming cytoskeletal proteins are essential for the structure and organization of all cells. Bacterial homologues of the major eukaryotic cytoskeletal families have now been discovered, but studies suggest that yet more remain to be identified. We demonstrate that the metabolic enzyme CTP synthase (CtpS) forms filaments in Caulobacter crescentus. CtpS is bifunctional, as the filaments it forms regulate the curvature of C. crescentus cells independently of its catalytic function. The morphogenic role of CtpS requires its functional interaction with the intermediate filament, crescentin (CreS). Interestingly, the Escherichia coli CtpS homologue also forms filaments both in vivo and in vitro, suggesting that CtpS polymerization may be widely conserved. E. coli CtpS can replace the enzymatic and morphogenic functions of C. crescentus CtpS, indicating that C. crescentus has adapted a conserved filament-forming protein for a secondary role. These results implicate CtpS as a novel bifunctional member of the bacterial cytoskeleton and suggest that localization and polymerization may be important properties of metabolic enzymes.


Figures

Figure 1
Figure 1. mCherry-CtpS is dynamic and co-localizes with linear filamentous structures along the inner curvature of Caulobacter cells
(a) mCherry-CtpS localization in asynchronous Caulobacter cells. mCherry-ctpS expressing cells (ZG153) were induced for two hours with xylose and imaged. A merged phase and fluorescence image is shown. Scale bar represents 2 μm. (b) mCherry-CtpS localization in synchronized Caulobacter cells. mCherry-ctpS expressing cells (ZG153) were induced for two hours with xylose, synchronized, and imaged at 10-minute intervals in the presence of xylose. Merged phase and fluorescence (top), fluorescence (middle), and cartoon depictions (bottom) are shown for two fields of representative cells at 0, 50, 80, and 110 minutes from the beginning of the timelapse. Scale bar represents 2 μm. (c) Co-localization of mCherry-CtpS and filamentous structures in Caulobacter. mCherry-ctpS expressing cells (ZG153) were fixed on EM grids and imaged first by fluorescence light microscopy and then by ECT. Shown is an ECT slice, phase-fluorescence overlay (left inset), and cartoon depiction (right inset) of the same cells. These cells correspond to cells #15 from the field shown in Figure S2. Arrows point to the ends of the filaments in the ECT image, which correspond to the positions of the mCherry-CtpS structure shown in the inset. Scale bars represent 100 nm for EM and 1 μm for the inset LM images.
Figure 2
Figure 2. CtpS forms filaments in Caulobacter.
(a–c) Tomographic slices through wild-type Caulobacter with endogenous ctpS levels (a, CB15N) and strains with mild (b, ZG215) and strong (c, ZG208) ctpS overexpression. Arrows point to the filament ends. (d–e) Merged phase and fluorescence (left) and fluorescence (right) images of cells expressing mCherry-ctpS (ZG153) in the absence (d) or presence (e) of 1 μM DON. (f) Tomographic slice of CB15N grown in 1 μM DON. (g–h) Heterologous expression of Caulobacter mCherry-ctpS in E. coli (g, ZG219) and S. pombe (h, ZG222). The mCherry-CtpS structures are delocalized by DON in both E.coli (i) and S. pombe (j). Phase-fluorescent merge (top) and fluorescent images (bottom) are shown in each case. Black scale bars (ECT slices) represent 100 nm and white scale bars (LM images) represent 2 μm.
Figure 3
Figure 3. CtpS regulates Caulobacter cell shape independently of enzymatic activity
(a) Morphological effect of overexpression and depletion of CtpS. Shown are phase images of wild type Caulobacter (left), and Caulobacter overexpressing (middle) or depleted (right) for CtpS. Above panels b–j is a cartoon representation of the synthetase and GAT domains of Caulobacter CtpS (not to scale). (b–d) Localization of wild-type and mCherry-CtpS point mutants. Merged phase-fluorescence (top) and fluorescence (bottom) images of cells expressing wild-type mCherry-CtpS (b, ZG153), synthetase domain mutant (c, ZG154), and GAT domain mutant (d, ZG155). (e–j) Effects of overexpression of wild-type CtpS (e, ZG208) and (h, ZG212), the synthetase mutant (f, ZG209) and (i, ZG213), and the GAT mutant (g, ZG210) and (j, ZG214) on cell shape (e–g) and CreS-tc localization (h–j). The arrow in (i) points to faint residual CreS-tc localization along the side of the cell. Scale bars are 2 μm.
Figure 4
Figure 4. CtpS regulates cell shape through an interaction with crescentin
(a–d) Cell morphology of Caulobacter cells with wild-type (a and b) and depleted (c and d) CtpS levels in a background either with creS (a and c, creS+, ZG215) or without creS (b and d, ΔcreS, ZG216). (e–f) Localization of Caulobacter mCherry-CtpS (red) in creS+ (e, ZG287) and ΔcreS (f, ZG285) backgrounds. Merged fluorescent images are shown, and the cell periphery is marked with a gfp fusion (green) to the periplasmic protein encoded by CC2395. (g) ECT filaments in ΔcreS cells (ZG17). Arrows point to filaments ends. (h–i) Co-localization of Caulobacter mCherry-CtpS (red) and CreS-tc (green) in both Caulobacter (h, ZG218) and upon heterologous co-expression in E.coli (i, ZG221). White scale bars represent 2 μm, black scale bars represent 100 nm.
Figure 5
Figure 5. The E. coli CtpS homolog forms filaments both in vivo and in vitro
(a) Localization of an mCherry fusion to the E. coli CtpS homolog (referred to here as EcCtpS but also known as pyrG) in E. coli. mCherry-EcCtpS expressing cells (ZG283) were induced for two hours with IPTG and imaged. Merged phase fluorescent (left) and fluorescent (right) images are shown. (b) Localization of the endogenous, untagged E.coli CtpS. Immunofluorescence microscopy was performed on wild type E. coli cells (NCM3722) probed with an α CtpS antibody. Merged phase and fluorescent (left) and fluorescent (right) images are shown. (c) Electron microscopy image of purified CtpS filaments observed in vitro after 10 minutes of incubation in CtpS activity buffer. (d) Localization of E.coli mCherry-EcCtpS in Caulobacter. A Caulobacter strain where Caulobacter CtpS was replaced with EcCtpS at the endogenous ctpS locus and mCherry-EcCtpS was expressed under the xylose promoter (ZG286) were induced with xylose and imaged. Shown are the phase fluorescent merged (left) and fluorescent (right) images. Black scale bars represent 2 μm; white scale bars represent 100 nm.

Comment in

  • A metabolic assembly line in bacteria.
    Cabeen MT, Jacobs-Wagner C. Cabeen MT, et al. Nat Cell Biol. 2010 Aug;12(8):731-3. doi: 10.1038/ncb0810-731. Nat Cell Biol. 2010. PMID: 20680001 No abstract available.

References

    1. Bi EF, Lutkenhaus J. FtsZ ring structure associated with division in Escherichia coli. Nature. 1991;354:161–164. doi: 10.1038/354161a0. - DOI - PubMed
    1. Lowe J, Amos LA. Crystal structure of the bacterial cell-division protein FtsZ. Nature. 1998;391:203–206. doi: 10.1038/34472. - DOI - PubMed
    1. Jones LJ, Carballido-Lopez R, Errington J. Control of cell shape in bacteria: helical, actin-like filaments in Bacillus subtilis. Cell. 2001;104:913–922. S0092-8674(01)00287-2 [pii] - PubMed
    1. Ausmees N, Kuhn JR, Jacobs-Wagner C. The bacterial cytoskeleton: an intermediate filament-like function in cell shape. Cell. 2003;115:705–713. S0092867403009358 [pii] - PubMed
    1. Briegel A, et al. Multiple large filament bundles observed in Caulobacter crescentus by electron cryotomography. Mol Microbiol. 2006;62:5–14. doi: 10.1111/j.1365-2958.2006.05355.x. MMI5355 [pii] - DOI - PubMed

Publication types

MeSH terms