. 2010 Aug;13(8):995-1002.
doi: 10.1038/nn.2599. Epub 2010 Jul 18.

The reorganization and reactivation of hippocampal maps predict spatial memory performance

Affiliations

The reorganization and reactivation of hippocampal maps predict spatial memory performance

David Dupret et al. Nat Neurosci. 2010 Aug.

Abstract

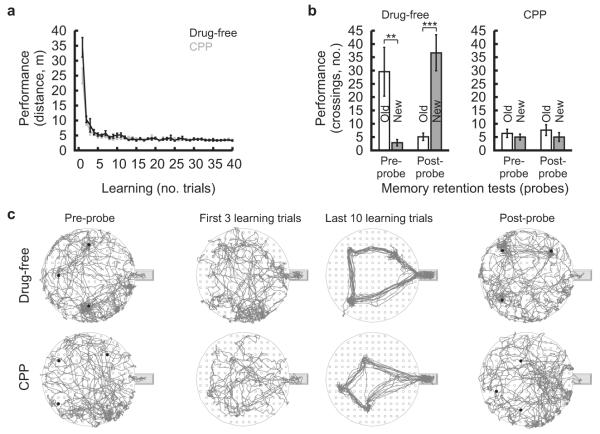
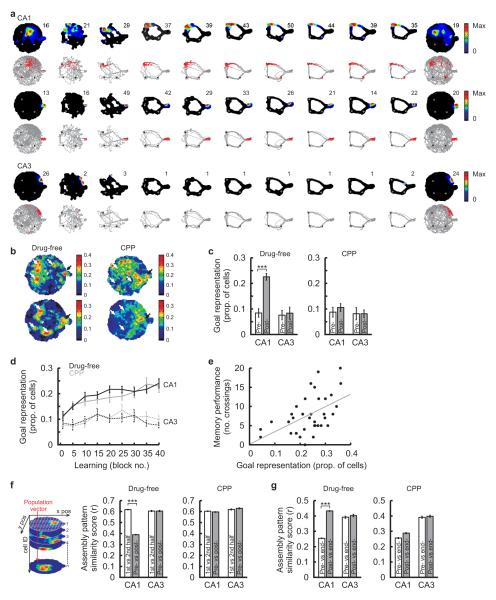
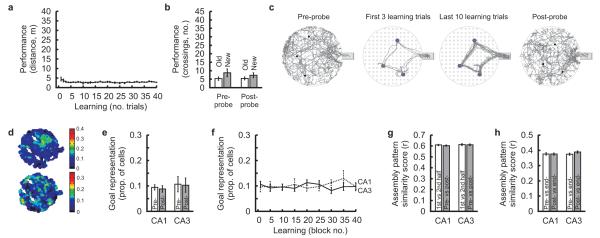
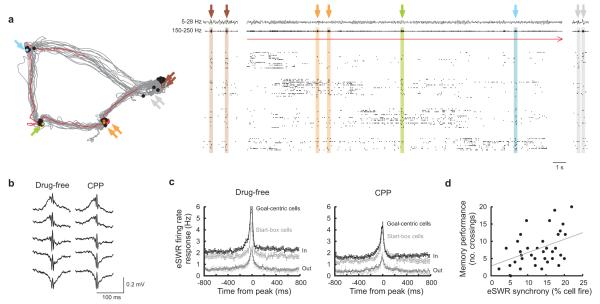
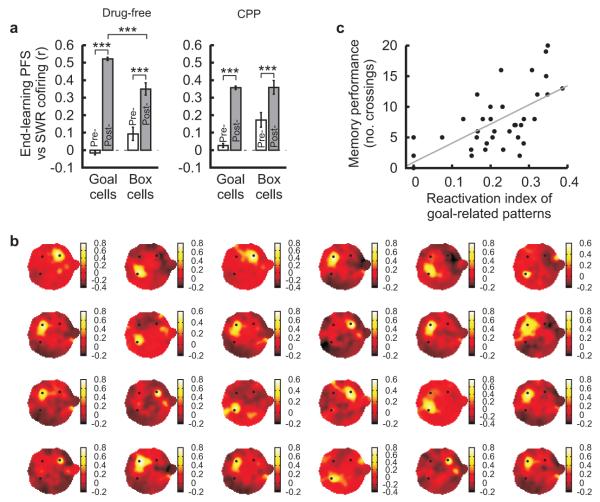
The hippocampus is an important brain circuit for spatial memory and the spatially selective spiking of hippocampal neuronal assemblies is thought to provide a mnemonic representation of space. We found that remembering newly learnt goal locations required NMDA receptor-dependent stabilization and enhanced reactivation of goal-related hippocampal assemblies. During spatial learning, place-related firing patterns in the CA1, but not CA3, region of the rat hippocampus were reorganized to represent new goal locations. Such reorganization did not occur when goals were marked by visual cues. The stabilization and successful retrieval of these newly acquired CA1 representations of behaviorally relevant places was NMDAR dependent and necessary for subsequent memory retention performance. Goal-related assembly patterns associated with sharp wave/ripple network oscillations, during both learning and subsequent rest periods, predicted memory performance. Together, these results suggest that the reorganization and reactivation of assembly firing patterns in the hippocampus represent the formation and expression of new spatial memory traces.


Figures

Figure 1
Figure 1. Daily learning of a new set of goal locations on the cheeseboard maze
Rats from the drug-free and the CPP conditions were trained in a matching-to-multiple-places task to locate a new set of 3 hidden food-rewards every day on a cheeseboard maze (Supplementary Fig. 1 and Methods). Learning performance was estimated by the distance travelled to find all rewards per trial (a, means±s.e.m, all Ps<0.00001, ANOVA). Memory retention performance was estimated by the number of crossings in goal areas (b, means±s.e.m, **: P<0.01, ***: P<0.001, paired t-test; see Methods and also Supplementary Fig. 2b). Crossings were compared for goal locations learnt the day before (“Old”) and the current day (“New”). Representative examples of animal’s path (c); for clarity, only the first 10 min of each probe session are depicted (black dots: learnt goal locations).
Figure 2
Figure 2. Goal-related reorganization of hippocampal assembly patterns
(a) Examples of hippocampal place cells recorded in the drug-free condition. Color-coded place rate maps (top rows) and individual spike locations superimposed on the animal’s path (bottom rows) are shown; see Supplementary Figs. 3,6,7 for further examples. Note that the upper CA1 cell reorganized its place field to a goal location (dots: goal locations) while the middle cell representing the start-box and bottom CA3 cell exhibited stable place fields across sessions. (b) Color-coded maps illustrating the post-probe spatial distribution of CA1 place fields in the drug-free and the CPP conditions. Pixel color represents the proportion of cells with place fields center at that x-y location (z scale=proportion of cells fire >80% of peak firing rate at that location). Note in the drug-free condition the higher proportion of cells associated with goal locations (white arrows) and the start-box (black arrow), and that bait-locations were not equally represented. (c-d) Proportion of place cells representing bait-locations (means±s.e.m; see Methods) during probe sessions (c) and across trials (d, CA1: solid lines, all Ps<0.0001; CA3: dashed lines, all Ps>0.291; ANOVA). The proportion of cells were calculated separately for each recording day and averaged. (e) Scatter plot showing post-probe memory performance (number of crossings) as a function of the proportion of CA1 place cells at goal locations during the end of learning ( grey: regression line, r=0.511, P=0.0014). (f-g) Similarity score of place-related assembly patterns (means±s.e.m) determined using a population vectors analysis within probe (f, 1st versus 2nd half), between probes (f, pre-versus post-), and between each probe and end of learning (g, pre-/post- versus end-). Left: schematic of the population vector analysis: rate maps were stacked into three-dimensional matrices for each waking period (the two spatial dimensions on the x and y axis, cell identity on the z axis); population vectors were calculated at each x-y bin; these were then correlated between periods and averaged across all bins (see Methods). pre-: pre-probe, post-: post-probe, end-: end of learning, ***: P<0.00, paired t-test.
Figure 3
Figure 3. Locating rewards during the Cued version of the cheeseboard maze task
(a-c) Learning performance was estimated by the distance travelled to find all 3 rewards per trial (a, means±s.e.m, P>0.209, ANOVA). Memory performance was estimated by the number of crossings in goal areas during probe sessions (b, means±s.e.m; see Methods and also Supplementary Fig. 2b). Crossings were compared for locations learnt the day before (“Old”) and the current day (“New”; all Ps>0.185, paired t-test). Representative examples of animal’s path (c; small black dots: goal locations; grey-filled circles: intra-maze cues); for the probes, only the first 10 min are depicted for clarity. Note that animals followed similarly efficient movement paths during the cued learning as they had in the absence of intra-maze cues (see Figure 1c). (d) Color-coded maps illustrating the post-probe spatial distribution of CA1 place fields. Pixel color represents the proportion of cells with place fields center at that x-y location (z scale=proportion of cells fire >80% of peak firing rate at that location). The white arrows indicate the learnt bait-locations. (e-f) Proportion of place cells representing bait-locations (means±s.e.m; see Methods) during probe sessions (e, pre- compared to post-: all Ps>0.692, paired t-test) and across trials (f, CA1: solid line, CA3: dashed line, all Ps>0.785, ANOVA). The proportion of cells were calculated separately for each recording day and averaged. Note that the proportion did not change during the cued learning. (g-h) Assembly patterns similarity score (means±s.e.m.) determined using a population vector analysis (see Methods) within probe (g, 1st versus 2nd half), between probes (g, pre- versus post-; 1st versus 2nd half compared to pre- versus post-: all Ps>0.401, paired t-test), and between each probe and end of learning (h, pre-/post- versus end-; pre- versus end- compared to post- versus end-: all Ps>0.122, paired t-test). Note that hippocampal assemblies remained similar in all three periods. pre-: pre-probe, post-: post-probe, end-: end of learning.
Figure 4
Figure 4. eSWR-associated activity of CA1 place cells
(a) Left: representative examples of the rat’s path (grey lines) from the end of learning with eSWR locations superimposed (filled dots). Right: example of network response during a single trial (red track). Top traces: band-pass filtered (theta 5-28Hz and SWR 150-250Hz bands) local field potential. Raster plot: spike timing of simultaneously recorded CA1 pyramidal cells (one cell per row). The vertical tics indicate the action potential times of these cells. Note the spatial tuning of cells around bait-locations and their eSWR firing response (arrows). (b) Traces of averaged eSWRs from the same rat in drug-free and CPP conditions. (c) eSWR firing rate histograms (means±s.e.m, see Methods) of CA1 “goal-centric” and “start-box” cells inside (“In”) and outside (“Out”) their place fields in drug-free and CPP conditions. (d) Scatter plot showing post-probe memory performance (number of crossings) as a function of “eSWR synchrony” (percentage of CA1 pyramidal cells that fire in eSWR) at the end of learning (in grey: regression line, r=0.418, P=0.011).
Figure 5
Figure 5. Reactivation of CA1 place-related assembly patterns
(a) Correlation between place field similarity (“PFS”) and sSWR cofiring calculated for “goal-centric” and “start-box” cell pairs (means±s.e.m, ***: P<0.001, paired t-test). The PFS was calculated using place fields established at the end of learning while sSWR cofiring was calculated in rest periods before (“pre-”) and after (“post-”) learning. Correlation coefficients represent the partial correlations of the PFS with the cofiring of one rest session, each controlled by the cofiring of the other rest session (see Methods). (b) Representative examples of individual sSWR reactivation maps (black dots: learnt goal locations). For each map, the pixel color represents the correlation coefficient between assembly firing patterns that occurred during a single sSWR and those representing that x-y location on the maze during the waking period (see Methods). Note that correlation coefficients are highest at one of the bait-locations (z scale: correlation coefficient). (c) Scatter plot showing post-probe memory performance (number of crossings at a given goal location) as a function of the proportion of sSWRs in which assembly patterns represented the same goal location (in grey: regression line, r=0.620, P=0.00005).

Comment in

  • Who moved my cheese (again)?
    Jeffery KJ, Cacucci F. Jeffery KJ, et al. Nat Neurosci. 2010 Aug;13(8):911-2. doi: 10.1038/nn0810-911. Nat Neurosci. 2010. PMID: 20661265

References

    1. O’Keefe J, Nadel L. The hippocampus as a cognitive map. Oxford University Press; Oxford,Clarendon: 1978.
    1. Squire LR. Memory and the hippocampus: a synthesis from findings with rats, monkeys, and humans. Psychol. Rev. 1992;99:195–231. - PubMed
    1. Morris RG. Elements of a neurobiological theory of hippocampal function: the role of synaptic plasticity, synaptic tagging and schemas. Eur. J. Neurosci. 2006;23:2829–2846. - PubMed
    1. Riedel G, et al. Reversible neural inactivation reveals hippocampal participation in several memory processes. Nat. Neurosci. 1999;2:898–905. - PubMed
    1. Hebb DO. The organization of behavior. Wiley; New York: 1949.

Publication types