Review
. 2010 Jun 17;11(6):2523-45.
doi: 10.3390/ijms11062523.

Nanocharacterization in dentistry

Affiliations
Review

Nanocharacterization in dentistry

Shivani Sharma et al. Int J Mol Sci. .

Abstract

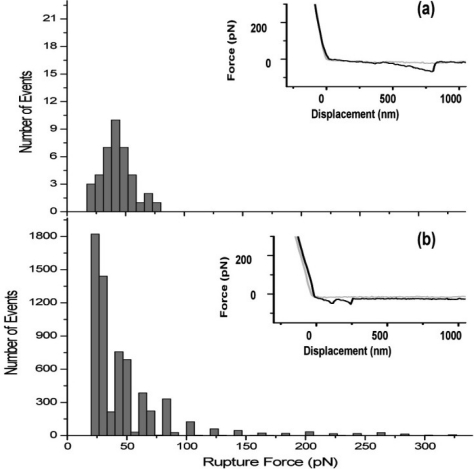
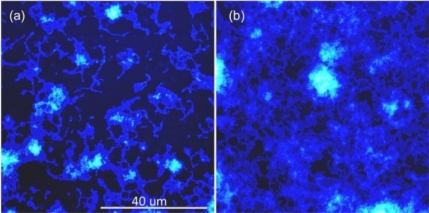
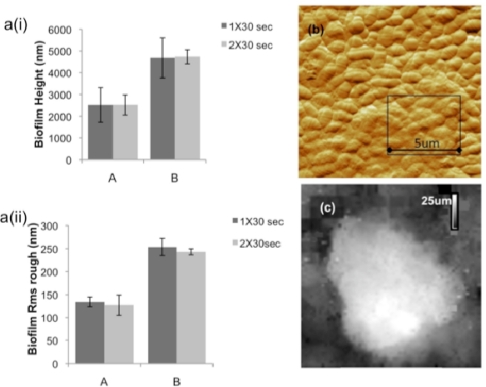
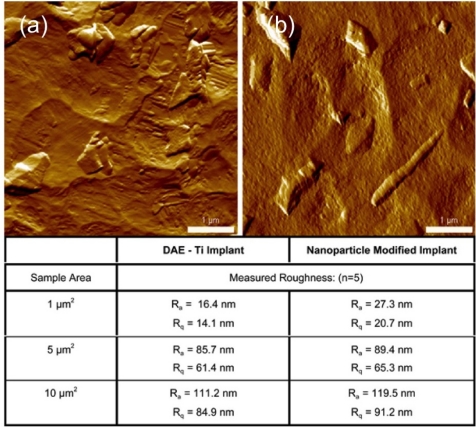
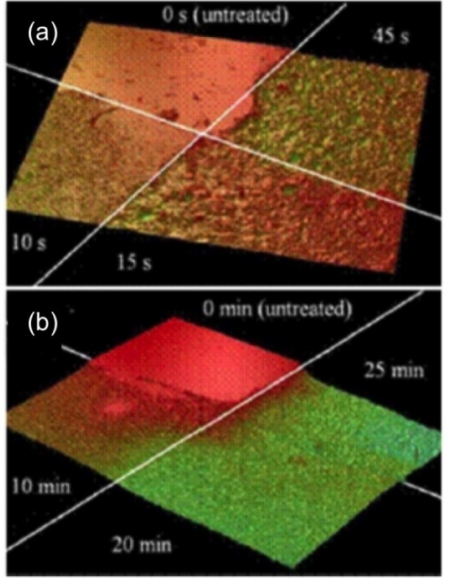
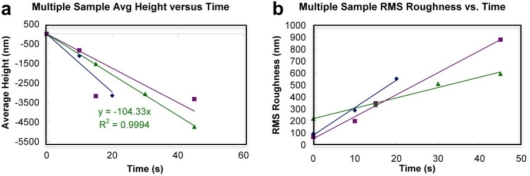
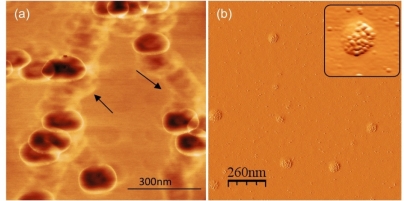
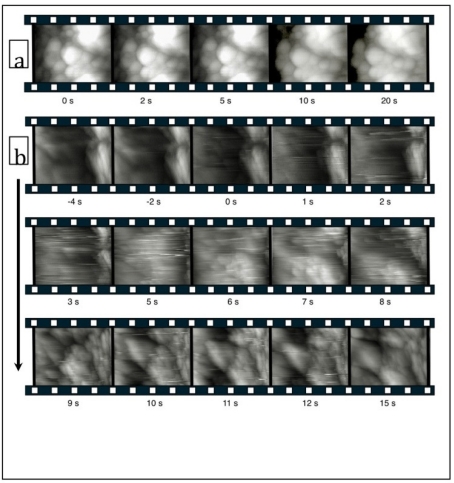
About 80% of US adults have some form of dental disease. There are a variety of new dental products available, ranging from implants to oral hygiene products that rely on nanoscale properties. Here, the application of AFM (Atomic Force Microscopy) and optical interferometry to a range of dentistry issues, including characterization of dental enamel, oral bacteria, biofilms and the role of surface proteins in biochemical and nanomechanical properties of bacterial adhesins, is reviewed. We also include studies of new products blocking dentine tubules to alleviate hypersensitivity; antimicrobial effects of mouthwash and characterizing nanoparticle coated dental implants. An outlook on future "nanodentistry" developments such as saliva exosomes based diagnostics, designing biocompatible, antimicrobial dental implants and personalized dental healthcare is presented.

Keywords: afm; bacterial adhesins; biofilms; dentine tubule; dentistry; implants; interferometry; nano-characterization; nanodentistry.


Figures

Figure 1
Figure 1
Atomic force microscopy (AFM) based nanoscale topographic, biophysical and biochemical characteristics of dental surfaces and structures.
Figure 2
Figure 2
(a) Inverted AFM amplitude image of untreated dentine surface with a single open tubule and surrounding exposed collagen network. White box marks periodic banding of ∼67 nm indicative of collagen D-banding. (b) Sectional profile of the collagen fibril. Reprinted with permission from [19]. Copyright 2009Yes Group, Inc.
Figure 3
Figure 3
(a) Inverted AFM amplitude images of untreated dentine surface with exposed and opened tubules. Visible helical structures can be seen on surface. (b) Dentine surface after ProClude prophylaxis paste treatment. Helical structures are absent from surface and tubules are occluded, suggesting the treatment resulted in a protective layer over the exposed dentine surface and sealing of the open tubules. Reprinted with permission from [19]. Copyright 2009Yes Group, Inc.
Figure 4
Figure 4
(a) AFM deflection mode image of a mechanically trapped S. mutans wild-type cell in fluid. The inset shows the height profile corresponding to the white line drawn along the long axis of the mechanically trapped cell. (b) Schematic representation of an AFM tip interacting with cell-surface macromolecules; A = Before tip-cell interaction; B = Tip pushing into cell surface; C = Tip pulling away from cell surface. The force-displacement curve shows typical tip-cell interactions. (c) Rupture force measured between the AFM tip and S. mutans UA140 wild-type cells at treatment time (0, 6, and 12 h). The average rupture force for the wild-type cells in each case, untreated control (0 h), 6 h and 12 h sucrose-treated is 84 ± 156, 304 ± 282 and 376 ± 563 pN, respectively (P < 0.00001 for control vs. both 6 h and 12 h) from n = 100 curves done on three individual cells in each case. Reprinted with permission from [37]. Copyright 2007 Society for General Microbiology.
Figure 5
Figure 5
Histograms of rupture force between the AFM tip and living S. mutans wapA mutant (a) and wild type (b) cells. Insets show typical force-displacement curves revealing adhesive interactions between the cantilever tip and cell surface in the retract trace. In the case of S. mutans wild type cells (b), adhesion forces for the observed rupture events ranged from ≈20–330 pN. Those observed for the wapA mutant cells (a) had a range between ≈20–80 pN. The average rupture force for the wapA mutant and UA140 wild type cells is 43 ± 13 pN and 84 ± 156 pN, respectively. Reprinted in part with permission from [45]. Copyright 2007 Society for General Microbiology.
Figure 6
Figure 6
(a) AFM height images showing topography of listerine treated S.mutans biofilm. (b) Untreated S. mutans biofilm topography showing clustered microcolonies. The peak biofilm height decreased from ∼1 μm to <0.5 μm when the biofilms were treated with mouthwash.
Figure 7
Figure 7
(a) Comparison of S. Mutans (A) mouthwash treated and (B) untreated biofilm peak height (i) and surface roughness (ii) for 1 × 30 s and 2 × 30 s treatment. (b) High resolution AFM topographic image showing rough EPS matrix of the biofilm visble as granular matrix surrounding the bacterial cell surfaces. (c) Scanning Ion Conductance Microscopy enables imaging larger scan area under physiological conditions. 64 × 64 μm2 S. mutans biofilm topography is shown here.
Figure 8
Figure 8
(a) AFM height images and surface roughness analysis showing variations in nanoscale topography between dual-acid-etched (DAE) titanium implant surface titanium before deposition of discrete hydroxyapatitenanoparticles. (b) After deposition of hydroxyapatitenanoparticles.
Figure 9
Figure 9
Optical Profiler analysis of citric acid induced dental enamel erosion analysis. (a) An image of four quadrants of dental enamel eroded for various times less than one minute. (b) Four quadrants of enamel topography showing erosion for various times less than 30 min (Image size 1240 × 940 μm). Reprinted with permission from [66]. Copyright 2009 Academy of Dental Materials Published by Elsevier Ltd.
Figure 10
Figure 10
Dental enamel surface height and roughness as metrics to quantify mineral loss. (a) Variation in surface height between one minute and 30 minutes. (b) Variation in roughness between one minute and 30 minutes (from image size 1240 × 940 μm). After about one minute the RMS roughness plateaus, as does the erosion rate. Data from several samples suggests erosion for less than one minute proceeding rapidly as pits are formed and the smooth enamel surface quickly roughens. Reprinted with permission from [66]. Copyright 2009 Academy of Dental Materials Published by Elsevier Ltd.
Figure 11
Figure 11
(a) Ultrastructure of individual saliva exosomes observed under AFM showing distinct round morphology of exosomes. AM-AFM phase image of aggregated exosomes indicates interconnections (arrows) lacking characteristic phase shift, probably indicate some extra-vesicular protein content. (b) Biochemical characterization of exosomes via AFM immunogold imaging. Inset shows 5 nm Au beads marking CD63 receptors on the exosome surface. Reprinted with permission from [70]. Copyright 2010 American Chemical Society.
Figure 12
Figure 12
Frames (1.5 μm × 1.5 μm) taken from HS AFM movies of the surface of polished bovine enamel. Film strip (a) is a sequence of images record in water; the film strips in (b) show a sequence of images recorded before, during, and after the addition of citric acid at pH 3. The time of the addition of the acid is marked as 0 s. Reprinted with permission from [85]. Copyright 2009 International Society of Histology and Cytology.

Similar articles

Cited by

References

    1. Freitas RA., Jr Nanodentistry. J. Am. Dent. Assoc. 2000;131:1559–1565. - PubMed
    1. Saunders SA. Current practicality of nanotechnology in dentistry. Part 1:Focus on nanocomposite restoratives and biomimetics. Clinic. Cosm. Invest. Dent. 2009;1:47–61. - PMC - PubMed
    1. Dufrene YF. Towards nanomicrobiology using atomic force microscopy. Nat. Rev. Microbiol. 2008;6:674–680. - PubMed
    1. Kasas S, Fellay B, Cargnello R. Observation of the action of penicillin on bacillus-subtilis using atomic-force microscopy - technique for the preparation of bacteria. Surf. Interf. Anal. 1994;21:400–401.
    1. Muller DJ, Baumeister W, Engel A. Controlled unzipping of a bacterial surface layer with atomic force microscopy. Proc. Natl. Acad. Sci. USA. 1999;96:13170–13174. - PMC - PubMed

Publication types

MeSH terms