. 2010 May 21:4:19.
doi: 10.3389/fnana.2010.00019. eCollection 2010.

Postnatal development of the endbulb of held in congenitally deaf cats

Affiliations

Postnatal development of the endbulb of held in congenitally deaf cats

Christa A Baker et al. Front Neuroanat. .

Abstract

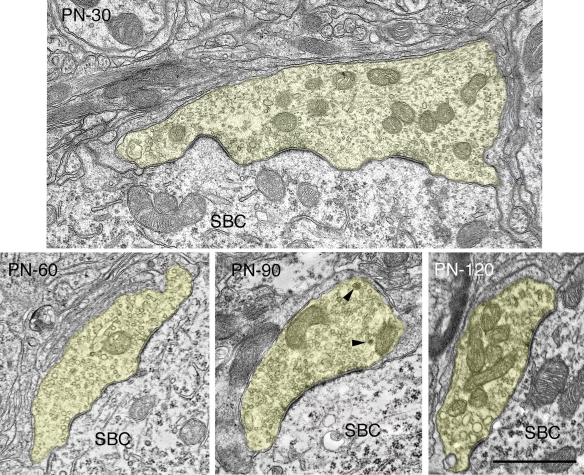
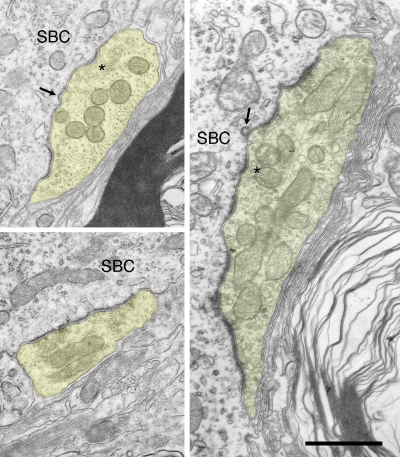
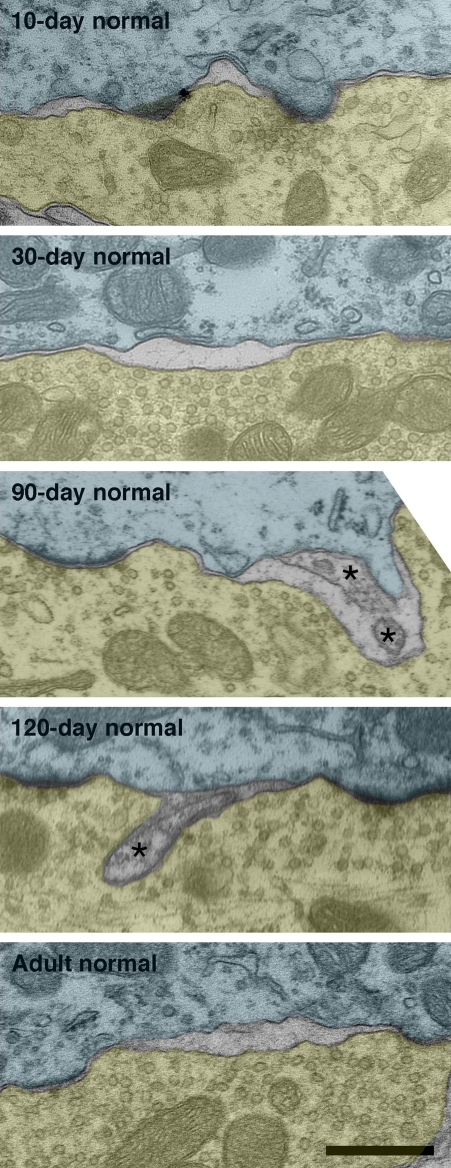
The endbulbs of Held are formed by the ascending branches of myelinated auditory nerve fibers and represent one of the largest synaptic endings in the brain. Normally, these endings are highly branched and each can form up to 1000 dome-shaped synapses. The deaf white cat is a model of congenital deafness involving a type of cochleosaccular degeneration that mimics the Scheibe deformity in humans. Endbulbs of mature deaf white cats exhibit reduced branching, hypertrophy of postsynaptic densities (PSDs), and changes in synaptic vesicle density. Because cats are essentially deaf at birth, we sought to determine if the progression of brain abnormalities was linked in time to the failure of normal hearing development. The rationale was that the lack of sound-evoked activity would trigger pathologic change in deaf kittens. The cochleae of deaf cats did not exhibit abnormal morphology at birth. After the first postnatal week, however, the presence of a collapsed scala media signaled the difference between deaf and hearing cats. By working backwards in age, endbulbs of deaf cats expressed flattened and elongated PSDs and increased synaptic vesicle density as compared to normal endbulbs. These differences are present at birth in some white kittens, presaging deafness despite their normal cochlear histology. We speculate that hearing pathology is signaled by a perinatal loss of spontaneous bursting activity in auditory nerve fibers or perhaps by some factor released by hair cell synapses before obliteration of the organ of Corti.

Keywords: auditory nerve; cochlear nucleus; hearing synapse; ultrastructure.


Figures

Figure 1
Figure 1
Light micrographs of mid-modiolar cochlear sections from pigmented kittens (pk, left column) and deaf white kittens (dwk, right column). At day 0 (top row), the cochleae of white and pigmented kittens are similar in appearance. Reissner's membrane and inner and outer hair cells (inset) are intact. At postnatal day 5 (middle row), the first sign of cochlear degeneration is seen in white kittens as Reissner's membrane begins its collapse onto the tectorial membrane (arrow). By postnatal day 10 (bottom row), Reissner's membrane has fallen completely, obliterating the scala media and destroying the organ of Corti. Hair cells are no longer distinguishable in the damaged organ of Corti (inset). Scale bar equals 100 μm and 50 μm in the inset.
Figure 2
Figure 2
Low magnification electron micrograph through the anteroventral cochlear nucleus (AVCN) of a newborn deaf white kitten. The cell body of spherical bushy cells (SBCs, outlined in red) is contacted by endbulbs of Held (yellow with black outlines). The segments of membrane contact between the two cells are irregular and “wavy” in appearance. Some lightly myelinated axons are visible in the AVCN at this age. Scale bar equals 5 μm.
Figure 3
Figure 3
Electron micrographs of endbulbs from a newborn (A) and 5-day old (B) deaf white kitten. (A) The endbulb (yellow) exhibits highly irregular surface contact with the spherical bushy cell (SBC) and contains somatic appendages (SA). Symmetric membrane thickenings mark puncta adherentia; asymmetric membrane thickenings and accumulations of synaptic vesicles mark PSDs (arrows). This newborn white kitten exhibited normal cochlear morphology but was produced by a breeding tom and queen that only give rise to deaf offspring; it had about half the normal number of PSDs in comparison to pigmented kittens, and its PSDs were about 50% longer than those of newborn pigmented animals. Large dense-core vesicles can be found away from active zones (arrowheads). (B) Electron micrograph of 5-day-old endbulb. This kitten exhibited cochlear pathology and its endbulb morphology was similar to that of a newborn white kitten. Scale bar equals 1 μm.
Figure 4
Figure 4
Electron micrographs of endbulbs from a 10-day (A) and 20-day (B) deaf white kitten. (A) The surface between the endbulb (yellow) and SBC membranes has flattened out compared to 0- and 5-day endbulbs and somatic appendages (SA) have decreased. The number of large dense-core vesicles (arrowhead) has also diminished. (B) Endbulb-SBC surface contact continues to flatten and SBC inclusions have essentially vanished in the 20-day endbulb. PSDs appear as asymmetric membrane thickenings with associated synaptic vesicles. Extremely long, flat PSDs are common in young deaf animals (inset). Scale bars equal 1 μm.
Figure 5
Figure 5
Plots illustrating and comparing the profile features of endbulbs from deaf (gray circles) and normal hearing (black triangles) cats with respect to age. (A) Average area of the endbulb profile is relatively large in both groups at birth and decreases as the endbulb reorganizes into smaller components between 10- and 20-days postnatal. Endbulbs from deaf cats are generally smaller than endbulbs from hearing cats. (B) Apposition length is a measure of membrane contact between the endbulb and the SBC; this contact is shorter in endbulbs of deaf cats for the first 3 months but stabilizes in older animals. (C) The ratio of straight-line length from one edge to the opposite edge of the apposition compared to the contour length of the apposition provides a measure of contact complexity. This ratio approaches one as the membrane between the endbulb and SBC flattens. Endbulb appositions of deaf cats are in general less curvy than those of normal cats before 30 days of age. (D) Somatic inclusions are common in young animals but disappear by 20–30 days. Deaf animals have fewer than half the number of inclusions present in normal animals at early ages. Each point represents an average of multiple measures collected from two animals at all time points except adult, where each point represents the average for one animal. Data values from normal hearing cats are replotted from Ryugo et al. (2006).
Figure 6
Figure 6
Plots quantifying membrane features of deaf (gray circles) and normal hearing (black triangles) endbulbs with respect to age. The number of puncta adherentia (A) and PSDs (B) diminishes over time in both groups. Deaf animals start with remarkably fewer PSDs than normal and thus the degree of change in PSD density is reduced in deaf endbulbs. The effect of deafness on puncta adherentia is less prominent. (C) The PSDs of deaf and normal hearing cats almost double in length from birth to adulthood, with deaf PSDs consistently larger than those of normal animals. (D) The relative amount of PSD contact between the endbulb and SBC exhibits no pronounced changes as a result of deafness. Each point represents an average of multiple measures collected from two animals at all time points except adult, where each point represents the average for one animal. Data values from normal hearing cats are replotted from Ryugo et al. (2006).
Figure 7
Figure 7
Plots quantifying organelle features of deaf (gray circles) and normal hearing (black triangles) endbulbs with respect to age. (A) The average size (cross-sectional area) of mitochondria does not change with age and is largely unaffected by deafness. (B) The percentage of endbulb profile occupied by mitochondria, however, shows a steady increase with age, most likely due to the progressive reduction of endbulb component size. Deafness has no profound impact on mitochondrial volume fraction. (C) The density of synaptic vesicles surrounding the PSD increases with age in both groups. In general, PSDs of endbulbs from deaf cats are associated with higher numbers of synaptic vesicles. (D) In normal animals, intermembraneous cisternae develop at about 10 days and reach an average of one to two per profile by 30-days postnatal. Interestingly, deaf animals never develop cisternae. (E) The number of large dense-core vesicles decreases during development in both cohorts with endbulbs of deaf animals exhibiting slightly more dense-core vesicles. Each point represents an average of multiple measures collected from two animals at all time points except adult, where each point represents the average for one animal. The data points in (E) for deaf 60- and 120-day-old animals represent values for only one animal each. Normal data values in (A,B and D) are replotted from Ryugo et al. (2006).
Figure 8
Figure 8
Electron micrographs highlighting maturational changes in endbulbs from 30-, 60-, 90-, and 120-day-old deaf white kittens. The endbulb profiles (yellow) have been reduced in size due to the repeated branching during maturation. The endbulb membrane apposition with the SBC has also reorganized from a highly corrugated surface to a smooth interface. The number of PSDs has decreased, whereas the lengths of the PSDs have increased. Large dense-core vesicles (arrowheads) are still present though their numbers have decreased. Scale bar equals 1 μm.
Figure 9
Figure 9
Electron micrographs of endbulbs from 150-day and 180-day deaf white cats. The most prominent and stable morphological features are flattening and lengthening of PSDs, accumulation of synaptic vesicles near the synapses, and increased mitochondrial volume fraction. Smaller, normal looking PSDs (*) are not uncommon in mature deaf animals but they are far outweighed by long flat synapses. Occasionally large dense-core vesicles (arrowheads) can be seen. Scale bar equals 1 μm.
Figure 10
Figure 10
Electron micrographs of endbulbs from adult deaf cats. These endbulbs typically exhibit a mixture of abnormal synapses characterized by long, flat PSDs and normal (*) ones. Postsynaptic coated vesicles (arrows) at varying stages of endocytosis can infrequently be seen at the SBC-endbulb interface. Scale bar equals 1 μm.
Figure 11
Figure 11
Electron micrographs of synapses from deaf cats. Synapses in deaf animals are marked by long, flat asymmetric membrane thickenings. The presence of small, dome-shaped PSDs is not uncommon in deaf animals, but a large portion of synapses are hypertrophied. From birth, synapses of deaf animals are considerably longer than normals. In fact, PSDs of newborn deaf cats are nearly as large those in mature hearing cats. At all ages, synapses of deaf cats are substantially elongated and flattened compared to those of age-matched hearing animals, including those of hearing littermates. As endbulbs mature, average PSD length grows as does the number of synaptic vesicles associated with synapses. Scale bar equals 0.5 μm.
Figure 12
Figure 12
Electron micrographs of 0-day, 20-day, 60-day, and adult synapses of normal hearing cats. PSDs are on average shorter in length and more dome-shaped than those of age-matched deaf animals. Additionally, fewer synaptic vesicles are seen in close proximity to normal synapses. Scale bar equals 0.5 μm.
Figure 13
Figure 13
Intermembraneous cisternae in 10-day, 30-day, 90-day, 120-day, and adult normal hearing cats. At around 10-days postnatal, endings of normal hearing kittens start developing spaces between the membranes of SBCs (green) and endbulbs (yellow). These spaces are not artifacts of fixation as surrounding structures are well preserved. Note that cisternae are often found in proximity to PSDs. Occasionally structures (asterisks) can be found occupying the intermembraneous spaces. Scale bar equals 0.5 μm.
Figure 14
Figure 14
Schematic of endbulb development in deaf (bottom) and normal hearing (top) cats. At birth in both cohorts, endbulb profiles have a convoluted membrane abutting the SBC which becomes less complex into adulthood. Endbulbs of deaf animals are in general smaller than normal. The number of PSDs (red) at birth in deaf animals is less than half that of normal. While mature endbulbs of both deaf and normal animals have the same number of PSDs, the PSDs of deaf animals are longer and flatter than the normal convex PSDs. Deaf endbulbs exhibit an increase in synaptic vesicle (black dots) density near the PSDs. No remarkable differences were seen with respect to mitochondria (large black) size or volume fraction between the two groups. Endbulbs of normal cats begin to develop cisternae (yellow) around postnatal day 10 while deaf endbulbs never develop them to any notable degree.

References

    1. Bosher S. K., Hallpike C. S. (1965). Observations on the histological features, development, and pathogenesis of the inner ear degeneration of the deaf white cat. Proc. R. Soc. Lond., B, Biol. Sci. 162, 147–17010.1098/rspb.1965.0030 - DOI - PubMed
    1. Bosher S. K., Hallpike C. S. (1967). Observations on the histogenesis of the inner ear degeneration of the deaf white cat and its possible relationship to the aetiology of certain unexplained varieties of human congenital deafness. J. Laryngol. Otol. 80, 222–235 - PubMed
    1. Brighton P., Ramesar R., Winship I. (1991). Hearing impairment and pigmentary disturbance. Ann. N. Y. Acad. Sci. 630, 152–16610.1111/j.1749-6632.1991.tb19584.x - DOI - PubMed
    1. Carr C. E., Konishi M. (1990). A circuit for detection of interaural time differences in the brain stem of the barn owl. J. Neurosci. 10, 3227–3246 - PMC - PubMed
    1. Deol M. S. (1970). The relationship between abnormalities of pigmentation and of the inner ear. Proc. R. Soc. Lond., B, Biol. Sci. 175, 201–21710.1098/rspb.1970.0019 - DOI - PubMed