. 2010 Sep;23(3):227-32.
doi: 10.1007/s10548-010-0154-x. Epub 2010 Jul 18.

Sensitivity of MEG and EEG to source orientation

Affiliations

Sensitivity of MEG and EEG to source orientation

Seppo P Ahlfors et al. Brain Topogr. 2010 Sep.

Abstract

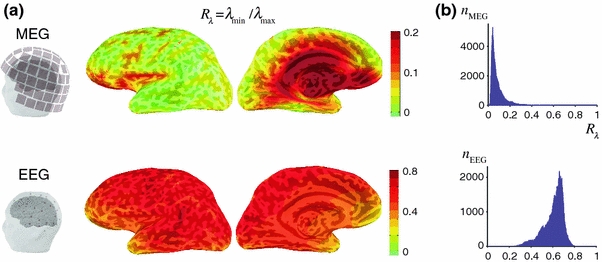
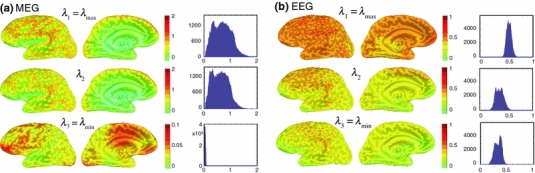
An important difference between magnetoencephalography (MEG) and electroencephalography (EEG) is that MEG is insensitive to radially oriented sources. We quantified computationally the dependency of MEG and EEG on the source orientation using a forward model with realistic tissue boundaries. Similar to the simpler case of a spherical head model, in which MEG cannot see radial sources at all, for most cortical locations there was a source orientation to which MEG was insensitive. The median value for the ratio of the signal magnitude for the source orientation of the lowest and the highest sensitivity was 0.06 for MEG and 0.63 for EEG. The difference in the sensitivity to the source orientation is expected to contribute to systematic differences in the signal-to-noise ratio between MEG and EEG.


Figures

Fig. 1
Fig. 1
Distribution of R λ, measuring the relative sensitivity to sources of different orientation and calculated as the ratio of the smallest and largest singular values of the dipole gain matrix for MEG (top) and EEG (bottom). a Spatial maps of R λ for the left hemisphere are shown in a lateral and medial view of an inflated representation of the cerebral cortex. The curvature of the cortex is indicated by darker (sulci) and lighter (gyri) regions through the semi-transparent color-coded map of R λ. Note the different color scales for MEG and EEG. The location of the MEG sensors and EEG electrodes with respect to the cortical surface and the scalp are shown on the left. b Histograms of the R λ values across all locations on the cortex, showing the number of vertices for MEG and EEG (n MEG, n EEG) with a given value of R λ
Fig. 2
Fig. 2
Distribution of the sensitivity to three orthogonal source components at each location on the cortex, indicated by the singular values (λ k,1 = λ k,max, λ k,2, λ k,3 = λ k,min) of the dipole gain matrix A k for MEG (a) and EEG (b). Note that for MEG, the color scales in the spatial map and the vertical scales in the histogram are different for the singular value for the orientation of the lowest sensitivity (λ k,3) from those for λ k,1 and λ k,2. The units for λ k,i are pT/nAm for MEG and μV/nAm for EEG

References

    1. Ahlfors SP, Han J, Lin FH, Witzel T, Belliveau JW, Hämäläinen MS, Halgren E. Cancellation of EEG and MEG signals generated by extended and distributed sources. Hum Brain Mapp. 2010;31:140–149. - PMC - PubMed
    1. Baillet S, Mosher JC, Leahy RM. Electromagnetic brain mapping. IEEE Signal Proc Mag. 2001;18:14–30. doi: 10.1109/79.962275. - DOI
    1. Baule G, McFee R. Theory of magnetic detection of the heart’s electrical activity. J Appl Phys. 1965;36:2066–2073. doi: 10.1063/1.1714404. - DOI
    1. Cohen D, Cuffin BN. Demonstration of useful differences between magnetoencephalogram and electroencephalogram. Electroencephalogr Clin Neurophysiol. 1983;56:38–51. doi: 10.1016/0013-4694(83)90005-6. - DOI - PubMed
    1. Cohen D, Cuffin BN. EEG versus MEG localization accuracy: theory and experiment. Brain Topogr. 1991;4:95–103. doi: 10.1007/BF01132766. - DOI - PubMed

Publication types

LinkOut - more resources