. 2010 Jul 19:11:382.
doi: 10.1186/1471-2105-11-382.

Integration and visualization of systems biology data in context of the genome

Affiliations

Integration and visualization of systems biology data in context of the genome

J Christopher Bare et al. BMC Bioinformatics. .

Abstract

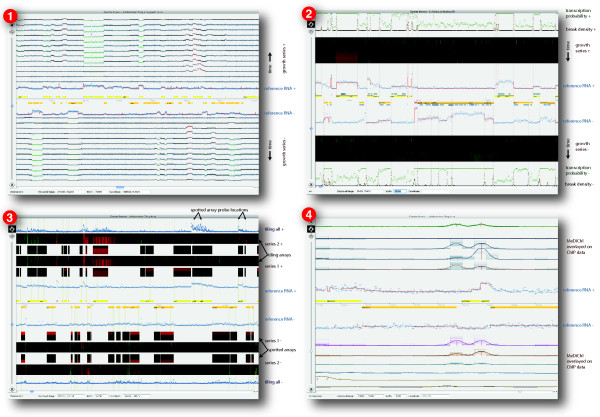
Background: High-density tiling arrays and new sequencing technologies are generating rapidly increasing volumes of transcriptome and protein-DNA interaction data. Visualization and exploration of this data is critical to understanding the regulatory logic encoded in the genome by which the cell dynamically affects its physiology and interacts with its environment.

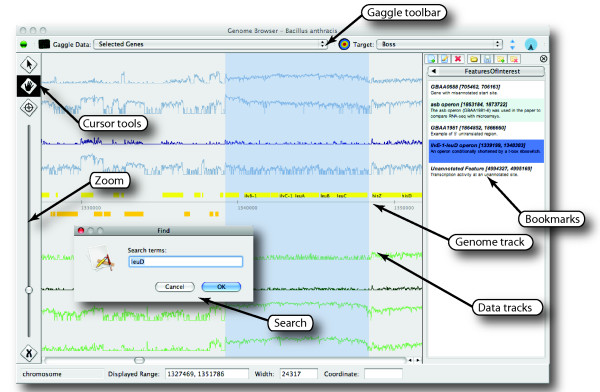
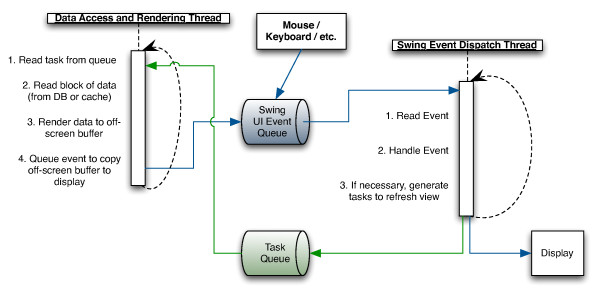
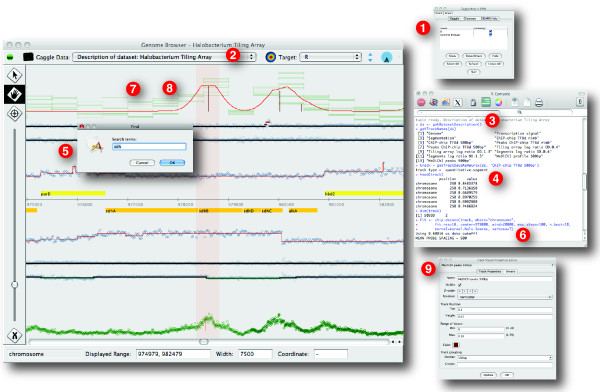
Results: The Gaggle Genome Browser is a cross-platform desktop program for interactively visualizing high-throughput data in the context of the genome. Important features include dynamic panning and zooming, keyword search and open interoperability through the Gaggle framework. Users may bookmark locations on the genome with descriptive annotations and share these bookmarks with other users. The program handles large sets of user-generated data using an in-process database and leverages the facilities of SQL and the R environment for importing and manipulating data.A key aspect of the Gaggle Genome Browser is interoperability. By connecting to the Gaggle framework, the genome browser joins a suite of interconnected bioinformatics tools for analysis and visualization with connectivity to major public repositories of sequences, interactions and pathways. To this flexible environment for exploring and combining data, the Gaggle Genome Browser adds the ability to visualize diverse types of data in relation to its coordinates on the genome.

Conclusions: Genomic coordinates function as a common key by which disparate biological data types can be related to one another. In the Gaggle Genome Browser, heterogeneous data are joined by their location on the genome to create information-rich visualizations yielding insight into genome organization, transcription and its regulation and, ultimately, a better understanding of the mechanisms that enable the cell to dynamically respond to its environment.


Figures

Figure 1
Figure 1
Features of Gaggle Genome Browser. Features of GGB include interactively panning and zooming through large amounts of user-generated data, dynamically scaling track data for effective display in limited screen resolution, integration with the Gaggle framework, search for named features, and facilities for creating and editing annotated bookmarks of regions of interest. Data shown here is RNA-seq measurements of the transcriptome of Bacillus anthracis by Passalacqua et al.
Figure 2
Figure 2
Object model and data flow. The basic classes of the domain model, highlighted in blue, are common to several genomics applications. A genome browser dataset consists of a list of sequences which define the coordinate system and tracks holding feature data to be plotted against those sequences. Data access (in yellow) is handled by loading contiguous blocks of feature data from an in-process database. An index can quickly determine which blocks intersect with the viewing area. Data flow (blue arrows) proceeds from the database through an LRU (least-recently-used) cache and is presented to TrackRenderers (in green) as tracks and features.
Figure 3
Figure 3
Queueing provides responsive user interface. The Swing event thread dispatches events from the AWT event queue (in blue) handling interaction with the user and the display. Data access and rendering tasks are placed in a task queue (in green) and executed on a separate thread. The results are rendered to an off-screen buffer which can then be rapidly copied onto the display by the UI event thread.
Figure 4
Figure 4
Gallery of Gaggle Genome Browser visualizations. (1) H. salinarum growth series showing 14 tracks of strand sensitive tiling array data taken as a time series during growth. The track nearest the horizontal axis shows reference RNA, while the remainder of the tracks are log ratios relative to the reference. Segmentation, overlaid on the reference RNA in red, computationally delimits transcriptional units. Ratios are also overlaid with segmentation, using red to indicate increased expression and green for decreased expression relative to the reference for that segment. This view shows about 200 thousand features out of 7.25 million in the whole dataset. (2) A view supporting curated annotation of transcriptional start and termination sites. Heatmaps are used to represent tiling array data relative to the reference condition, shown with blue circles overlaid with segmentation in red. Computed boundaries of transcription are drawn as dashed verticals with supporting statistics shown in brown and green along the outer edge. Blue blocks show PFAM domains. Dark blue bars show computationally predicted operons. (3) A comparison of array platforms. Data from different tiling array platforms is compared to spotted expression arrays. On the outer edge, we overlay all time points from both replicates giving some idea about the distribution of values at each point. (4) MeDiChI profiles and predicted binding sites overlay multiple replicates of ChIP-chip data for several transcription factors, showing TF binding sites in relation to genes and transcription data.
Figure 5
Figure 5
Comparison of image rendering times for different datasets and zoom levels. Complexity of the visual representation has a large effect on rendering time, as does the number of features visible in the viewing area. Whiskers indicate the range of rendering times, while boxes show the middle two quartiles. Rendering is usually under one second even for very complex renderings on workstation class hardware and slower but still acceptable on a low-end machine. Slower rendering times are associated with cache misses. The B. anthracis dataset (43 million features total, shown in figure 1) is the fastest to render, benefiting from the scaling renderer that adapts to zoom level. The H. salinarum dataset (7.25 million features total, shown in panel 1 of figure 4) is of moderate complexity with 30 total tracks. Shown are rendering times for a zoomed in view with 20 thousand features visible and a zoomed out view with 200 thousand features visible. The S. solfataricus dataset, (27 million features total, shown in panel 2 of figure 4) with 39 tracks including heatmaps shows slowest rendering times. We show rendering times for 10 thousand and 20 thousand features. While more zoomed out views of datasets with heatmaps render slowly, the program remains responsive at all times.
Figure 6
Figure 6
Processing track data in R with the MeDiChI ChIP-chip deconvolution algorithm. GGB can be used in conjunction with the R environment for statistical computing through the Gaggle framework. After connecting both the genome browser and R to the Gaggle framework (1) we broadcast a description of the dataset using the Gaggle toolbar (2) from the genome browser to R. We can then inspect the dataset in R (3) and load track data into the R environment (4). Locating the region of interest, the sdh operon, using the search feature (5) we then apply MeDiChI's chip.deconv function to the track (6). From R, we broadcast data to the genome browser which then creates new tracks for model fit (7) and peaks (8). We then adjust the visual properties of the new tracks (9) to display predicted transcription factor binding sites.

References

    1. Bonneau R, Facciotti MT, Reiss DJ, Schmid AK, Pan M, Kaur A, Thorsson V, Shannon P, Johnson MH, Bare JC, Longabaugh W, Vuthoori M, Whitehead K, Madar A, Suzuki L, Mori T, Chang D, Diruggiero J, Johnson CH, Hood L, Baliga NS. A predictive model for transcriptional control of physiology in a free living cell. Cell. 2007;131:1354–1365. doi: 10.1016/j.cell.2007.10.053. - DOI - PubMed
    1. Shannon PT, Reiss DJ, Bonneau R, Baliga NS. The Gaggle: an open-source software system for integrating bioinformatics software and data sources. BMC Bioinformatics. 2006;7:176. doi: 10.1186/1471-2105-7-176. - DOI - PMC - PubMed
    1. Java. http://www.java.com/download/
    1. SQLite. http://www.sqlite.org/
    1. Shannon P, Markiel A, Ozier O, Baliga NS, Wang JT, Ramage D, Amin N, Schwikowski B, Ideker T. Cytoscape: A Software Environment for Integrated Models of Biomolecular Interaction Networks. Genome Research. 2003;13:2498–2504. doi: 10.1101/gr.1239303. - DOI - PMC - PubMed

Publication types