

Dendritic signals command firing dynamics in a mathematical model of cerebellar Purkinje cells
- PMID: 20643060
- PMCID: PMC2905124
- DOI: 10.1016/j.bpj.2010.04.056
Dendritic signals command firing dynamics in a mathematical model of cerebellar Purkinje cells
Abstract
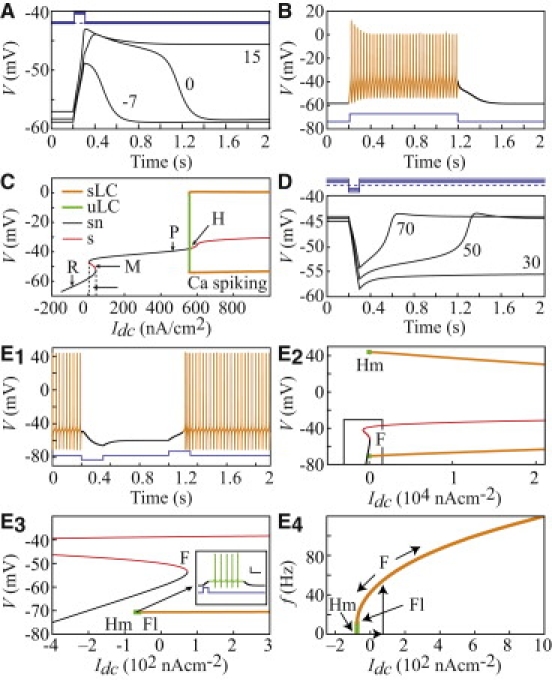
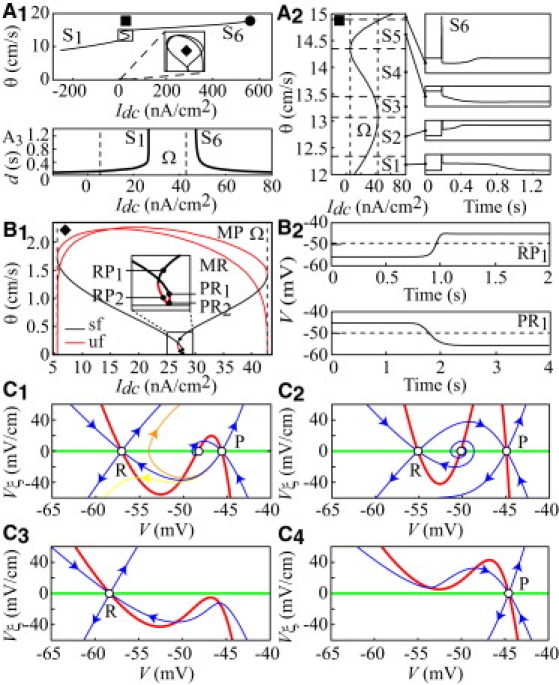
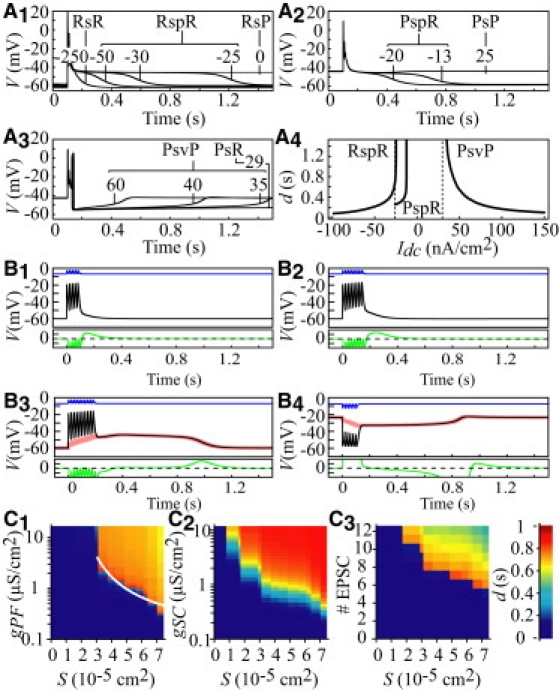
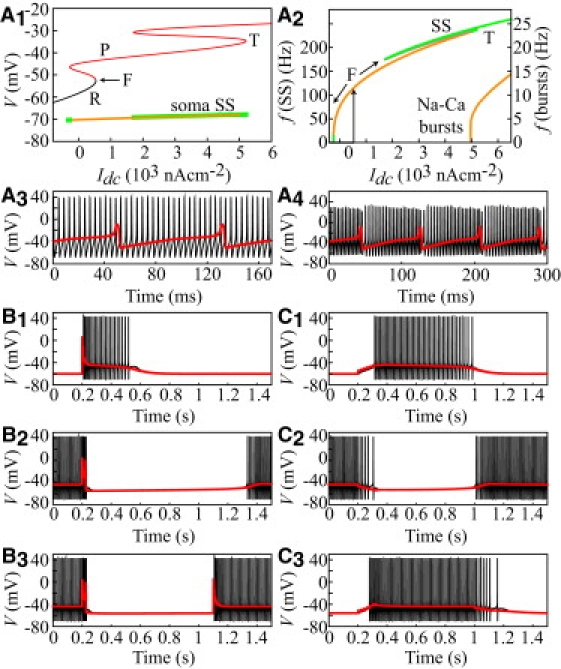
Dendrites of cerebellar Purkinje cells (PCs) respond to brief excitations from parallel fibers with lasting plateau depolarizations. It is unknown whether these plateaus are local events that boost the synaptic signals or they propagate to the soma and directly take part in setting the cell firing dynamics. To address this issue, we analyzed a likely mechanism underlying plateaus in three representations of a reconstructed PC with increasing complexity. Analysis in an infinite cable suggests that Ca plateaus triggered by direct excitatory inputs from parallel fibers and their mirror signals, valleys (putatively triggered by the local feed forward inhibitory network), cannot propagate. However, simulations of the model in electrotonic equivalent cables prove that Ca plateaus (resp. valleys) are conducted over the entire cell with velocities typical of passive events once they are triggered by threshold synaptic inputs that turn the membrane current inward (resp. outward) over the whole cell surface. Bifurcation analysis of the model in equivalent cables, and simulations in a fully reconstructed PC both indicate that dendritic Ca plateaus and valleys, respectively, command epochs of firing and silencing of PCs.
Copyright (c) 2010 Biophysical Society. Published by Elsevier Inc. All rights reserved.
Figures
Similar articles
-
A biophysical model of nonlinear dynamics underlying plateau potentials and calcium spikes in purkinje cell dendrites.J Neurophysiol. 2002 Nov;88(5):2430-44. doi: 10.1152/jn.00839.2001. J Neurophysiol. 2002. PMID: 12424284
-
Low-threshold potassium channels and a low-threshold calcium channel regulate Ca2+ spike firing in the dendrites of cerebellar Purkinje neurons: a modeling study.Brain Res. 2001 Feb 9;891(1-2):106-15. doi: 10.1016/s0006-8993(00)03206-6. Brain Res. 2001. PMID: 11164813
-
Period doubling of calcium spike firing in a model of a Purkinje cell dendrite.J Comput Neurosci. 2001 Jul-Aug;11(1):43-62. doi: 10.1023/a:1011252730249. J Comput Neurosci. 2001. PMID: 11524577
-
Dendritic calcium signaling in cerebellar Purkinje cell.Neural Netw. 2013 Nov;47:11-7. doi: 10.1016/j.neunet.2012.08.001. Epub 2012 Sep 5. Neural Netw. 2013. PMID: 22985934 Review.
-
Dendritic low-threshold Ca2+ channels in rat cerebellar Purkinje cells: possible physiological implications.Cerebellum. 2003;2(3):196-205. doi: 10.1080/14734220310016141. Cerebellum. 2003. PMID: 14509569 Review.
Cited by
-
Purkinje cell models: past, present and future.Front Comput Neurosci. 2024 Jul 10;18:1426653. doi: 10.3389/fncom.2024.1426653. eCollection 2024. Front Comput Neurosci. 2024. PMID: 39049990 Free PMC article. Review.
-
The 40-year history of modeling active dendrites in cerebellar Purkinje cells: emergence of the first single cell "community model".Front Comput Neurosci. 2015 Oct 20;9:129. doi: 10.3389/fncom.2015.00129. eCollection 2015. Front Comput Neurosci. 2015. PMID: 26539104 Free PMC article. Review.
-
Conditional Bistability, a Generic Cellular Mnemonic Mechanism for Robust and Flexible Working Memory Computations.J Neurosci. 2018 May 30;38(22):5209-5219. doi: 10.1523/JNEUROSCI.1992-17.2017. Epub 2018 Apr 30. J Neurosci. 2018. PMID: 29712783 Free PMC article.
References
-
- Ito M. Raven Press; New York: 1984. The Cerebellum and Neural Control.
-
- Llinás R., Sugimori M. The electrophysiology of the cerebellar Purkinje cell revisited. In: Llinás R., Sotelo C., editors. The Cerebellum Revisited. Springer Verlag; New York: 1992. pp. 167–181.
-
- Mintz I.M., Adams M.E., Bean B.P. P-type calcium channels in rat central and peripheral neurons. Neuron. 1992;9:85–95. - PubMed
MeSH terms
LinkOut - more resources
Full Text Sources
Molecular Biology Databases
Miscellaneous
