. 2010 Jul 21;99(2):534-43.
doi: 10.1016/j.bpj.2010.04.055.

Mathematical modeling of K-Ras nanocluster formation on the plasma membrane

Affiliations

Mathematical modeling of K-Ras nanocluster formation on the plasma membrane

Tianhai Tian et al. Biophys J. .

Abstract

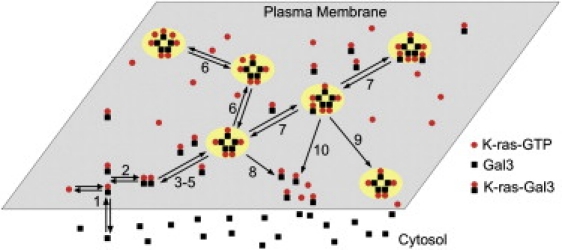
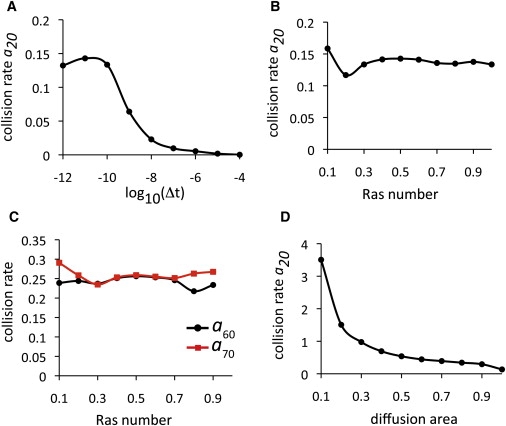
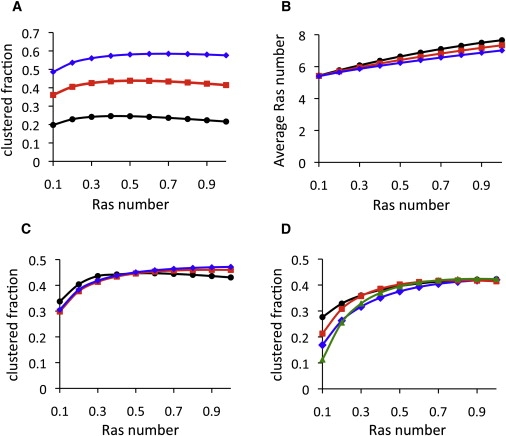
K-Ras functions as a critical node in the mitogen-activated protein kinase (MAPK) pathway that regulates key cellular functions including proliferation, differentiation, and apoptosis. Following growth factor receptor activation K-Ras.GTP forms nanoclusters on the plasma membrane through interaction with the scaffold protein galectin-3. The generation of nanoclusters is essential for high fidelity signal transduction via the MAPK pathway. To explore the mechanisms underlying K-Ras.GTP nanocluster formation, we developed a mathematical model of K-Ras-galectin-3 interactions. We designed a computational method to calculate protein collision rates based on experimentally determined protein diffusion rates and diffusion mechanisms and used a genetic algorithm to search the values of key model parameters. The optimal estimated model parameters were validated using experimental data. The resulting model accurately replicates critical features of K-Ras nanoclustering, including a fixed ratio of clustered K-Ras.GTP to monomeric K-Ras.GTP that is independent of the concentration of K-Ras.GTP. The model reproduces experimental results showing that the cytosolic level of galectin-3 determines the magnitude of the K-Ras.GTP clustered fraction and illustrates that nanoclustering is regulated by key nonequilibrium processes. Our kinetic model identifies a potential biophysical mechanism for K-Ras nanoclustering and suggests general principles that may be relevant for other plasma-membrane-localized proteins.


Figures

Figure 1
Figure 1
Model of K-Ras protein diffusion and collision to form nanoclusters. In this model, K-Ras.GTP diffuses randomly on the plasma membrane. Gal3 is confined to the cytosol unless recruited to the plasma membrane by K-Ras.GTP (1). Assembly of K-Ras nanoclusters proceeds by collision of Ras-Gal3 complexes to form dimers (2) and subsequently pentamers (3-5). Formation of nanoclusters with a higher stochiometry is possible by collision of additional K-Ras.GTP proteins or Ras-Gal3 complexes with Ras-Gal3 pentamers (6,7). Disassembly of a nanocluster can proceed either by complete disaggregation into the constituent K-Ras.GTP monomers and Ras-Gal3 complexes (8,10) or by loss of single K-Ras.GTP or Ras-Gal3 complexes (6,7,9).
Figure 2
Figure 2
Computation of protein collision rates on the plasma membrane. (A) Collision rate (a20/s) of Ras-Gal3 complexes calculated for different time lags. (B) Collision rate (a20/s) of Ras-Gal3 complexes calculated for a fixed time lag, Δt = 10−10 s and different numbers of K-Ras.GTP proteins on the plasma membrane. The maximal number of K-Ras.GTP on the plasma membrane is denoted as the unit 1. (C) Collision rates of Ras (a60/s) and Ras-Gal3 complexes (a70/s) with nanoclusters based on a fixed time lag, Δt = 10−10 s, and different numbers of K-Ras.GTP proteins in nanoclusters on the plasma membrane. (D) Calculated collision rate (a20/s) of Ras-Gal3 complexes if diffusion is restricted to a proportion of the diffusion area.
Figure 3
Figure 3
Estimated Gal3 numbers and simulated nanocluster formation dynamics. (A) Estimated Gal3 numbers in 10 sets of model parameters using the genetic algorithm. The Gal3 numbers are presented as the ratio of Gal3 to Ras. (B) Simulation results of K-Ras nanocluster formation showing the progression of the system to equilibrium. We simulated the complete model shown in Fig. 1 for 5 min of real time with the following estimated kinetic rates: a1 = 1.2786 × 10⁻⁷/ s, d1 = 0.0595/ s, a2 = 0.0101/ s, d2 = 0.9483/ s, a6 = 2.4791 × 10⁻⁵/ s, a7 = 4.7839 × 10⁻⁴/ s, d6 = 2.5/ s, d7 = 2.5/ s, d8 = 2.5/ s, d9 = 0.0999/ s, and d10 = 0.0596/ s. The nonzero initial conditions are [Ras] = 774,000, [Gal3] = 43,730. (C) Average K-Ras.GTP number in each nanocluster during the course of the simulation. (D) Distribution of nanoclusters with different numbers of K-Ras.GTP proteins. (E) Stochastic simulation results of K-Ras nanocluster formation showing the progression of the system to equilibrium. We simulated biochemical reactions 1–10 (see MethodsMethods) for 5 min of real time with the same kinetic rates as in B. (F) Average K-Ras.GTP number in each nanocluster during the course of the simulation.
Figure 4
Figure 4
The Gal3 number determines nanocluster formation. (A) Fraction of K-Ras.GTP in nanoclusters with different numbers of Gal3 in the cytosol. The model was simulated for 5 min of real time with Gal3/K-Ras.GTP ratios of 0.25, 0.565, and 1 (circles, ratio = 0.25; squares, ratio = 0.565; diamonds, ratio = 1). (B) Average K-Ras number/nanocluster with different numbers of Gal3 in the cytosol (circles, Gal3/K-Ras.GTP ratio = 0.25; squares, ratio = 0.565; diamonds, ratio = 1). (C) Fraction of K-Ras.GTP in nanoclusters assuming a fixed Gal3 number in the cytosol and estimating other modeling parameters based on the assumed Gal3 number (circles, Gal3 = 0.565 × (max K-Ras number) and all the other rates as presented in Fig. 2; squares, Gal3 = (max K-Ras number); diamonds, Gal3 = 2 × (max K-Ras number); triangles, Gal3 = 5 × (max K-Ras number)). (D) Clustered fraction of K-Ras when Gal3 number equals the maximal number of K-Ras.GTP. In each case shown, one of the kinetic rates was changed to realize the experimental result that ∼42% of K-Ras molecules are in nanoclusters when the K-Ras number is maximal (circles, a1 = a1 / 2.8; squares, d1 = d1 × 1.25; diamonds, a2 = a2 / 28; triangles, d2 = d2 × 700). In all four figures, the maximal number of K-Ras.GTP on the plasma membrane is denoted as the unit 1.
Figure 5
Figure 5
Nanocluster formation for different values of binding rate a2. Fraction of K-Ras.GTP in nanoclusters assuming a fixed value of binding rate a2 and estimating other kinetic rates and Gal3 number based on the assumed value of a2: diamonds, a2 = 0.0101 / s; squares, a2 = 0.001 / s; circles, a2 = 0.0001 / s; triangles, a2 = 0.00001 / s. The maximal number of K-Ras.GTP on the plasma membrane is denoted as the unit 1.

Similar articles

Cited by

References

    1. Cox A.D., Der C.J. The dark side of Ras: regulation of apoptosis. Oncogene. 2003;22:8999–9006. - PubMed
    1. Downward J. Targeting RAS signalling pathways in cancer therapy. Nat. Rev. Cancer. 2003;3:11–22. - PubMed
    1. Huang C.Y., Ferrell J.E. Ultrasensitivity in the mitogen-activated protein kinase cascade. Proc. Natl. Acad. Sci. USA. 1996;93:10078–10083. - PMC - PubMed
    1. Bhalla U.S., Ram P.T., Iyengar R. MAP kinase phosphatase as a locus of flexibility in a mitogen-activated protein kinase signaling network. Science. 2002;297:1018–1023. - PubMed
    1. Tian T., Harding A., Hancock J.F. Plasma membrane nanoswitches generate high-fidelity Ras signal transduction. Nat. Cell Biol. 2007;9:905–914. - PubMed

Publication types

LinkOut - more resources