

Mapping quantitative traits and strategies to find quantitative trait genes
- PMID: 20643209
- PMCID: PMC3036800
- DOI: 10.1016/j.ymeth.2010.07.007
Mapping quantitative traits and strategies to find quantitative trait genes
Abstract
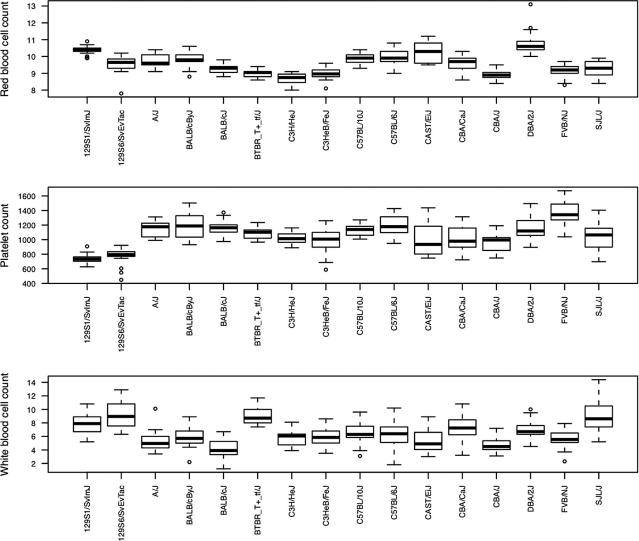
In 1999 a meeting took place at the Jackson Laboratory, a large mouse research centre in Bar Harbor, Maine, to consider the value of systematically collecting phenotypes on inbred strains of mice (Paigen and Eppig (2000) [1]). The group concluded that cataloguing the extensive phenotypic diversity present among laboratory mice, and in particular providing the research community with data from cohorts of animals, phenotyped according to standardized protocols, was essential if we were to take advantage of the possibilities of mouse genetics. Beginning with the collection of basic physiological, biochemical and behavioral data on nine commonly used inbred strains, the project has expanded so that by the beginning of 2010 data for 178 strains had been collected, with 105 phenotype projects yielding over 2000 different measurements (Bogue et al. (2007) [2].
Copyright © 2010 Elsevier Inc. All rights reserved.
Figures
Similar articles
-
Replication of small effect quantitative trait loci for behavioral traits facilitated by estimation of effect size from independent cohorts.Genes Brain Behav. 2006 Jul;5(5):404-12. doi: 10.1111/j.1601-183X.2005.00174.x. Genes Brain Behav. 2006. PMID: 16879634
-
A novel strategy for genetic dissection of complex traits: the population of specific chromosome substitution strains from laboratory and wild mice.Mamm Genome. 2010 Aug;21(7-8):370-6. doi: 10.1007/s00335-010-9270-x. Epub 2010 Jul 11. Mamm Genome. 2010. PMID: 20623355 Review.
-
Analysing complex genetic traits with chromosome substitution strains.Nat Genet. 2000 Mar;24(3):221-5. doi: 10.1038/73427. Nat Genet. 2000. PMID: 10700173 Review.
-
Chromosome substitution strains: a new way to study genetically complex traits.Methods Mol Med. 2006;128:153-72. doi: 10.1385/1-59745-159-2:153. Methods Mol Med. 2006. PMID: 17071995
-
Genetic analysis in the Collaborative Cross breeding population.Genome Res. 2011 Aug;21(8):1223-38. doi: 10.1101/gr.113886.110. Epub 2011 Jul 6. Genome Res. 2011. PMID: 21734011 Free PMC article.
Cited by
-
High-resolution genetic mapping of complex traits from a combined analysis of F2 and advanced intercross mice.Genetics. 2014 Sep;198(1):103-16. doi: 10.1534/genetics.114.167056. Genetics. 2014. PMID: 25236452 Free PMC article.
-
Cancer evolution and individual susceptibility.Integr Biol (Camb). 2011 Apr;3(4):316-28. doi: 10.1039/c0ib00094a. Epub 2011 Jan 24. Integr Biol (Camb). 2011. PMID: 21264404 Free PMC article. Review.
-
Genome-wide association for testis weight in the diversity outbred mouse population.Mamm Genome. 2018 Jun;29(5-6):310-324. doi: 10.1007/s00335-018-9745-8. Epub 2018 Apr 24. Mamm Genome. 2018. PMID: 29691636 Free PMC article.
-
Taar1 gene variants have a causal role in methamphetamine intake and response and interact with Oprm1.Elife. 2019 Jul 9;8:e46472. doi: 10.7554/eLife.46472. Elife. 2019. PMID: 31274109 Free PMC article.
-
Quantitative trait Loci association mapping by imputation of strain origins in multifounder crosses.Genetics. 2012 Feb;190(2):459-73. doi: 10.1534/genetics.111.135095. Epub 2011 Dec 5. Genetics. 2012. PMID: 22143921 Free PMC article.
References
Publication types
MeSH terms
Grants and funding
LinkOut - more resources
Full Text Sources
