

The effect of lead on bone mineral properties from female adult C57/BL6 mice
- PMID: 20643234
- PMCID: PMC3386851
- DOI: 10.1016/j.bone.2010.07.013
The effect of lead on bone mineral properties from female adult C57/BL6 mice
Abstract
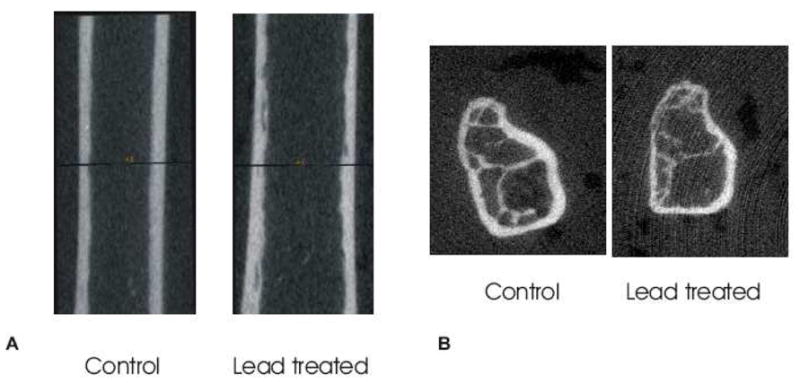
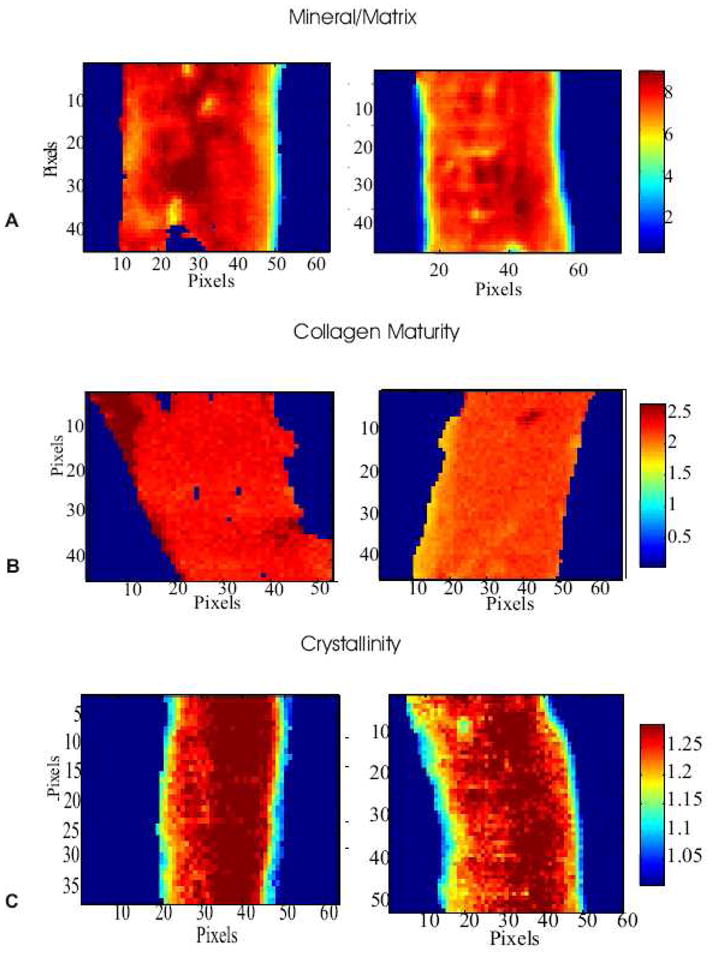
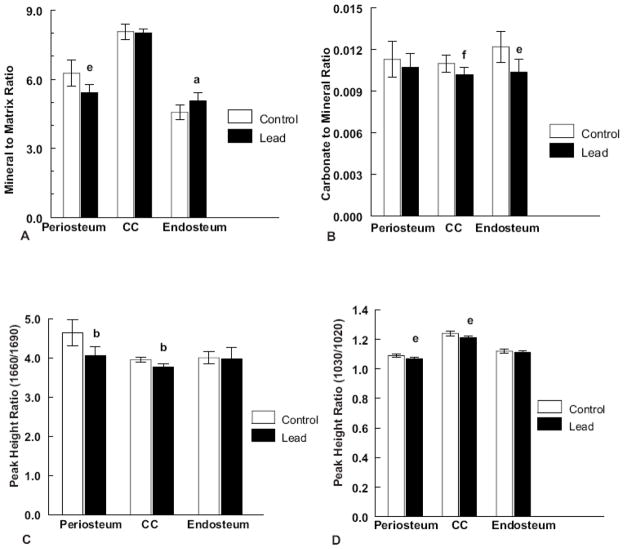
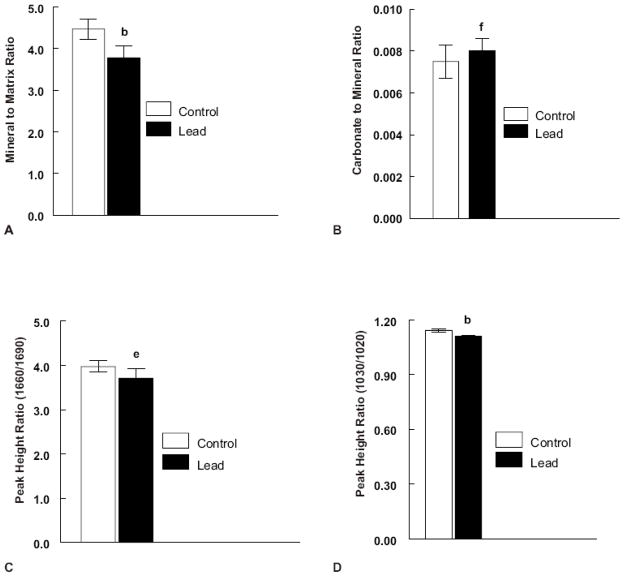
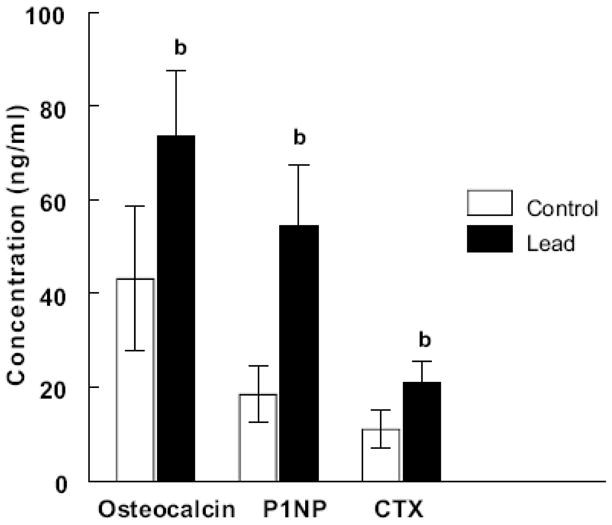
Lead toxicity is a significant problem in the U.S. with elevated blood lead levels being highest among very young children and older adults >50 years old. Bone is the major reservoir of body lead, accounting for 75% in children and 90% in adults. Very little is known about the effect of lead on bone mineral properties in adults. We investigated the effect of lead on the femora from adult, 6 month old female C57/BL6 mice who were administered lead in the drinking water (250 ppm, blood lead 33 μg/dL) for 4 months. Bone mineral properties were examined using Fourier Transform Infrared Microscopy (FTIRM), quantitative microcomputed tomography (microCT) and whole bone mechanical testing. Lead significantly decreased the bone mineral density in the cortical and proximal cancellous bone and increased the marrow area in the cortical bone with microCT. Whole bone three-point bending showed a trend of decreased maximum and failure moments in the lead treated bones compared to controls. Lead significantly decreased the mineral/matrix ratio, collagen maturity and crystallinity in the trabecular bone as measured by FTIRM. In the cortical bone lead significantly decreased collagen maturity and bone crystal size by FTIRM. In contrast to cell culture studies, lead significantly increased serum osteocalcin levels. Lead also significantly increased the bone formation and resorption markers suggesting increased bone turnover. These data show that lead increases bone turnover resulting in weaker cortical bone in adult female mice and suggest that lead may exacerbate bone loss and osteoporosis in the elderly.
Copyright © 2010 Elsevier Inc. All rights reserved.
Figures
Similar articles
-
Lead induced differences in bone properties in osteocalcin +/+ and -/- female mice.Bone Rep. 2023 Mar 17;18:101672. doi: 10.1016/j.bonr.2023.101672. eCollection 2023 Jun. Bone Rep. 2023. PMID: 37064000 Free PMC article.
-
Osteocalcin affects bone mineral and mechanical properties in female mice.Bone. 2019 Nov;128:115031. doi: 10.1016/j.bone.2019.08.004. Epub 2019 Aug 8. Bone. 2019. PMID: 31401301 Free PMC article.
-
Infrared analysis of the mineral and matrix in bones of osteonectin-null mice and their wildtype controls.J Bone Miner Res. 2003 Jun;18(6):1005-11. doi: 10.1359/jbmr.2003.18.6.1005. J Bone Miner Res. 2003. PMID: 12817752
-
Regulation of mineral-to-matrix ratio of lumbar trabecular bone in ovariectomized rats treated with risedronate in combination with or without vitamin K2.J Bone Miner Metab. 2004;22(5):404-14. doi: 10.1007/s00774-004-0502-6. J Bone Miner Metab. 2004. PMID: 15316861
-
The mineralization of bone tissue: a forgotten dimension in osteoporosis research.Osteoporos Int. 2003;14 Suppl 3:S19-24. doi: 10.1007/s00198-002-1347-2. Epub 2003 Mar 18. Osteoporos Int. 2003. PMID: 12730799 Review.
Cited by
-
Lead induced differences in bone properties in osteocalcin +/+ and -/- female mice.Bone Rep. 2023 Mar 17;18:101672. doi: 10.1016/j.bonr.2023.101672. eCollection 2023 Jun. Bone Rep. 2023. PMID: 37064000 Free PMC article.
-
Association of Bone Turnover Levels with MTHFR Gene Polymorphisms among Pregnant Women in Wuhan, China.Curr Med Sci. 2018 Aug;38(4):602-609. doi: 10.1007/s11596-018-1920-3. Epub 2018 Aug 20. Curr Med Sci. 2018. PMID: 30128868
-
Effects of Combined Exposure to Lead and High-Fat Diet on Bone Quality in Juvenile Male Mice.Environ Health Perspect. 2015 Oct;123(10):935-43. doi: 10.1289/ehp.1408581. Epub 2015 Apr 10. Environ Health Perspect. 2015. PMID: 25861094 Free PMC article.
-
Allicin Alleviates Lead-Induced Bone Loss by Preventing Oxidative Stress and Osteoclastogenesis Via SIRT1/FOXO1 Pathway in Mice.Biol Trace Elem Res. 2021 Jan;199(1):237-243. doi: 10.1007/s12011-020-02136-5. Epub 2020 Apr 21. Biol Trace Elem Res. 2021. PMID: 32314144
-
Association between urinary lead and bone health in a general population from Taiwan.J Expo Sci Environ Epidemiol. 2016 Sep;26(5):481-7. doi: 10.1038/jes.2015.30. Epub 2015 Jul 8. J Expo Sci Environ Epidemiol. 2016. PMID: 26152405
References
Publication types
MeSH terms
Substances
Grants and funding
LinkOut - more resources
Full Text Sources
Other Literature Sources
Medical
