. 2010 Jul 20;19(1):90-102.
doi: 10.1016/j.devcel.2010.06.016.

Neogenin regulation of BMP-induced canonical Smad signaling and endochondral bone formation

Affiliations

Neogenin regulation of BMP-induced canonical Smad signaling and endochondral bone formation

Zheng Zhou et al. Dev Cell. .

Abstract

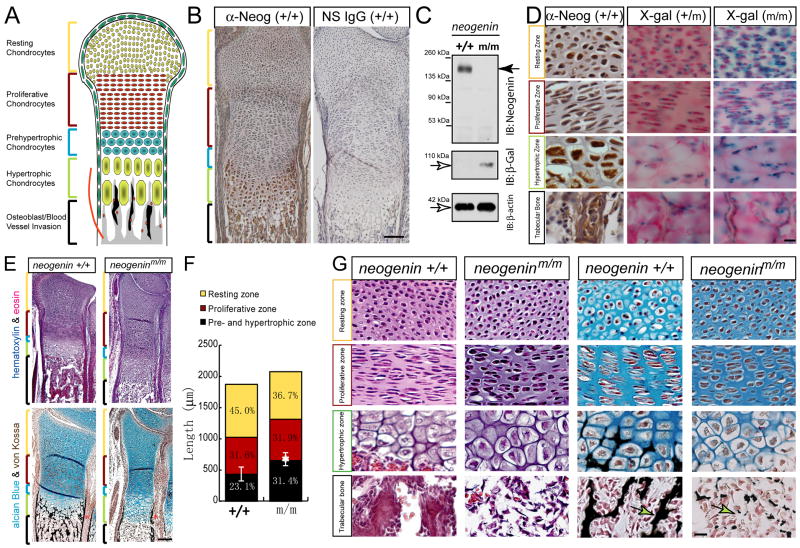
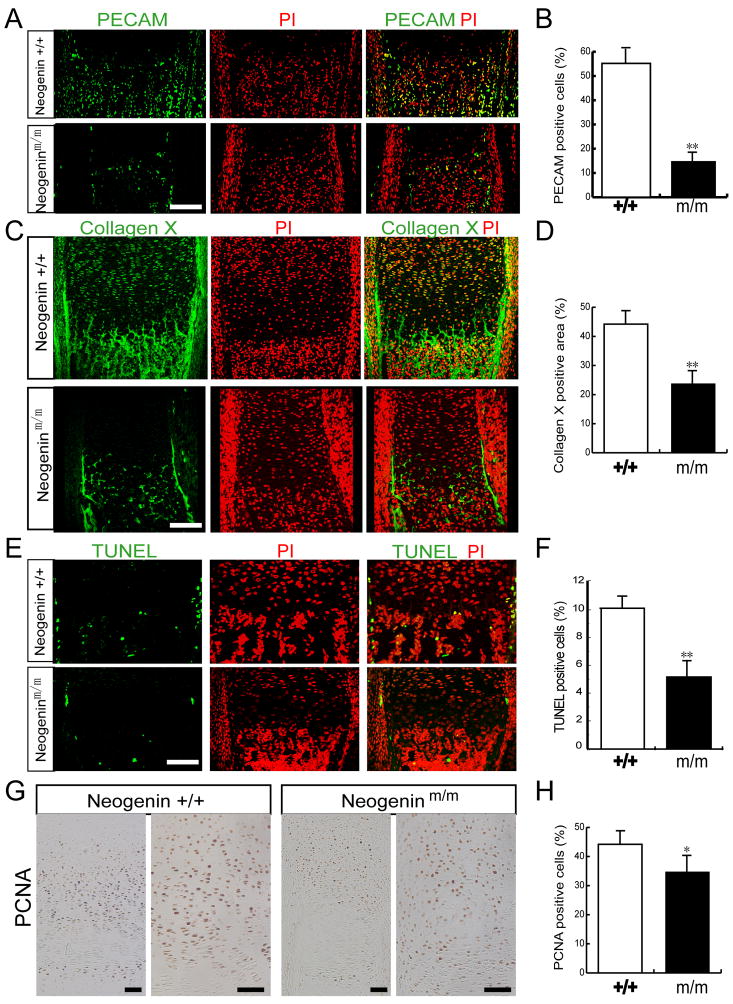
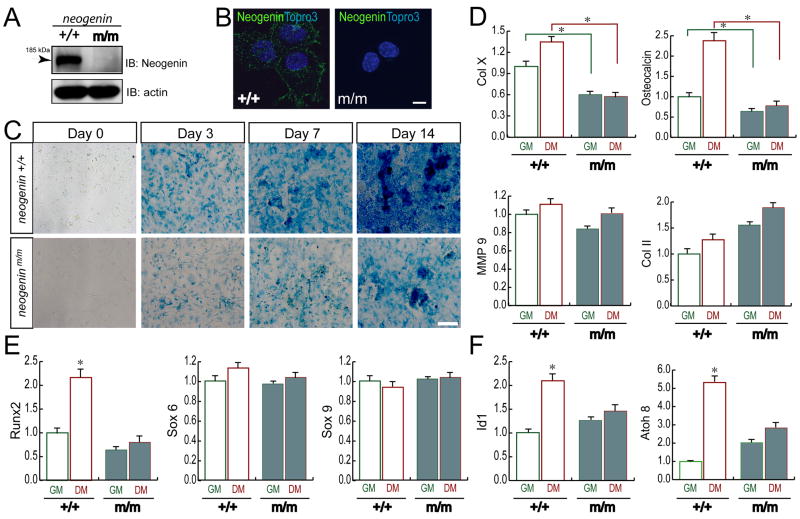
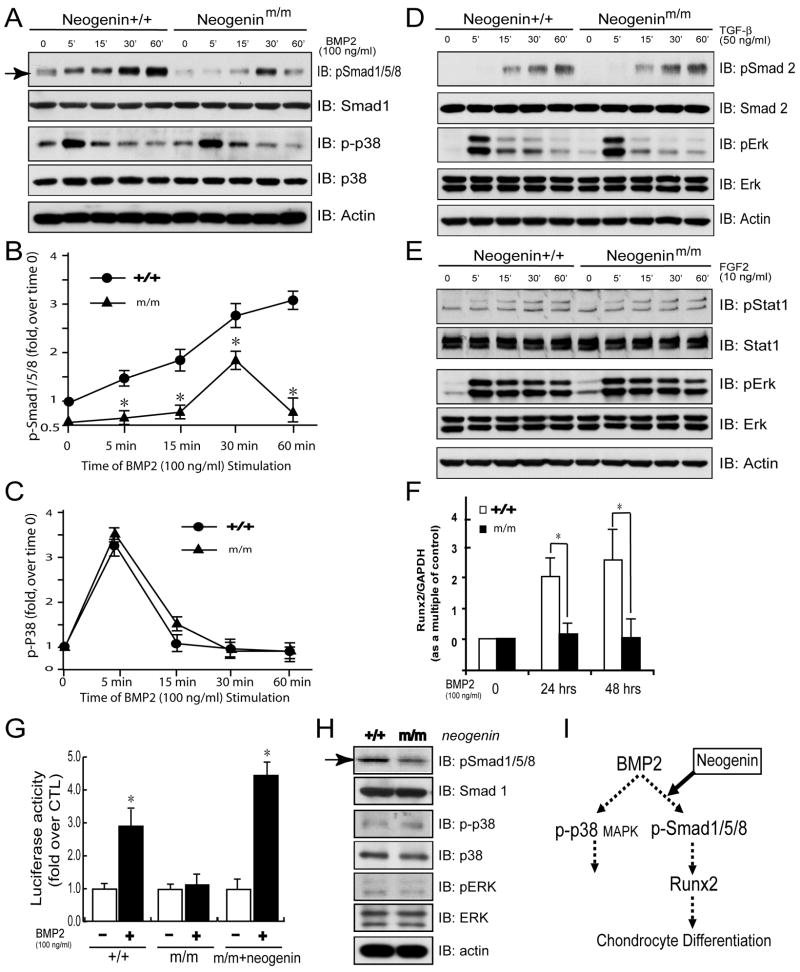
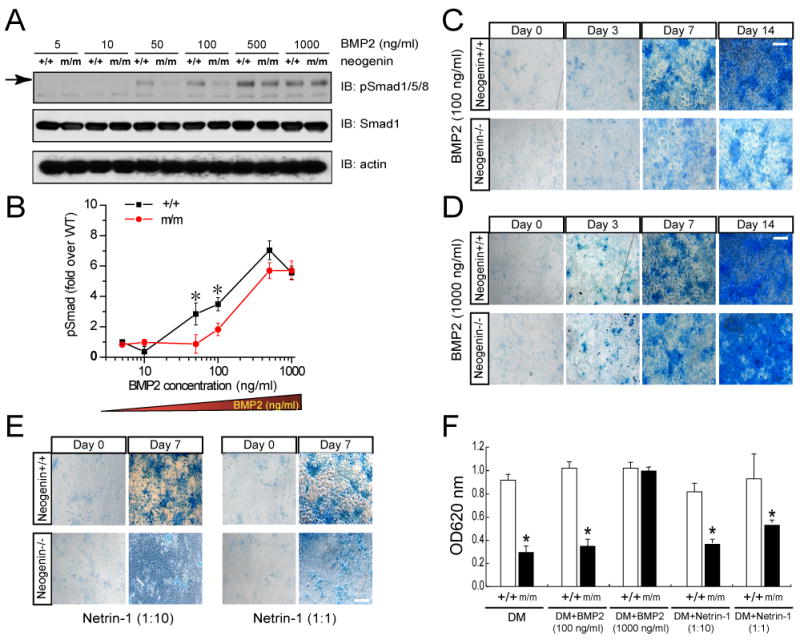
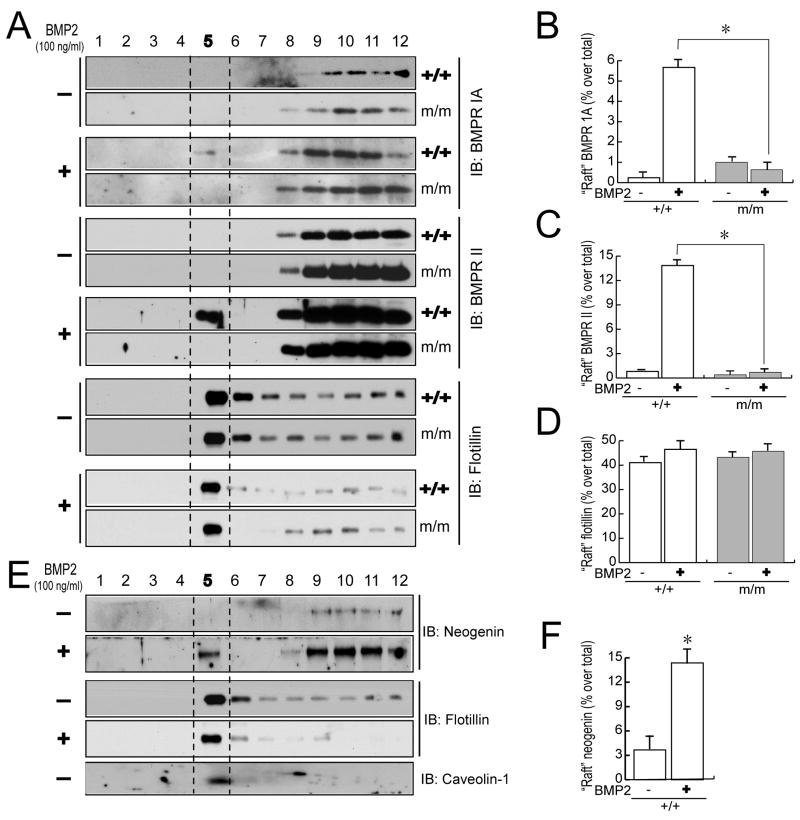
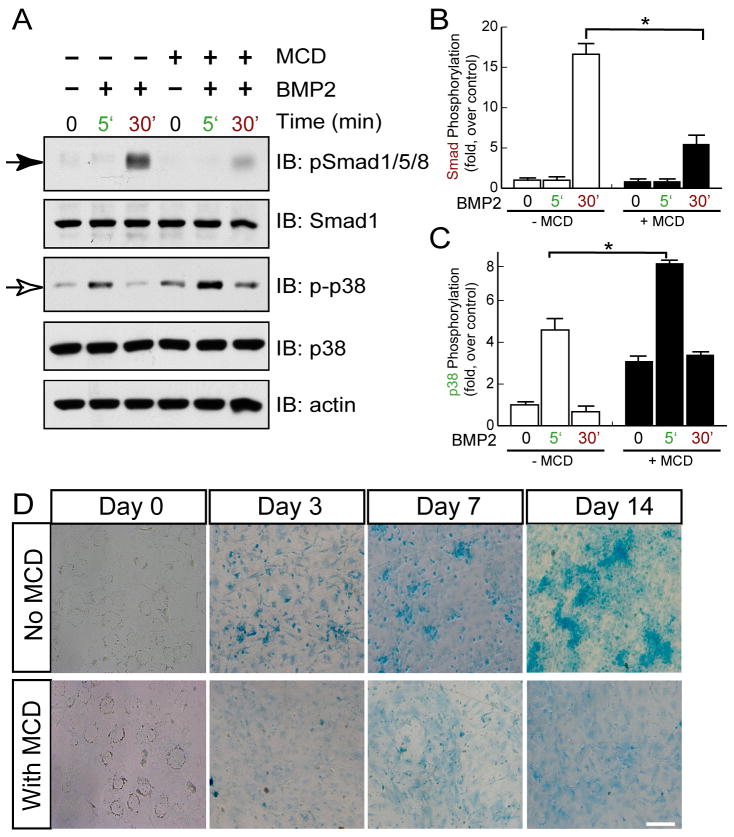
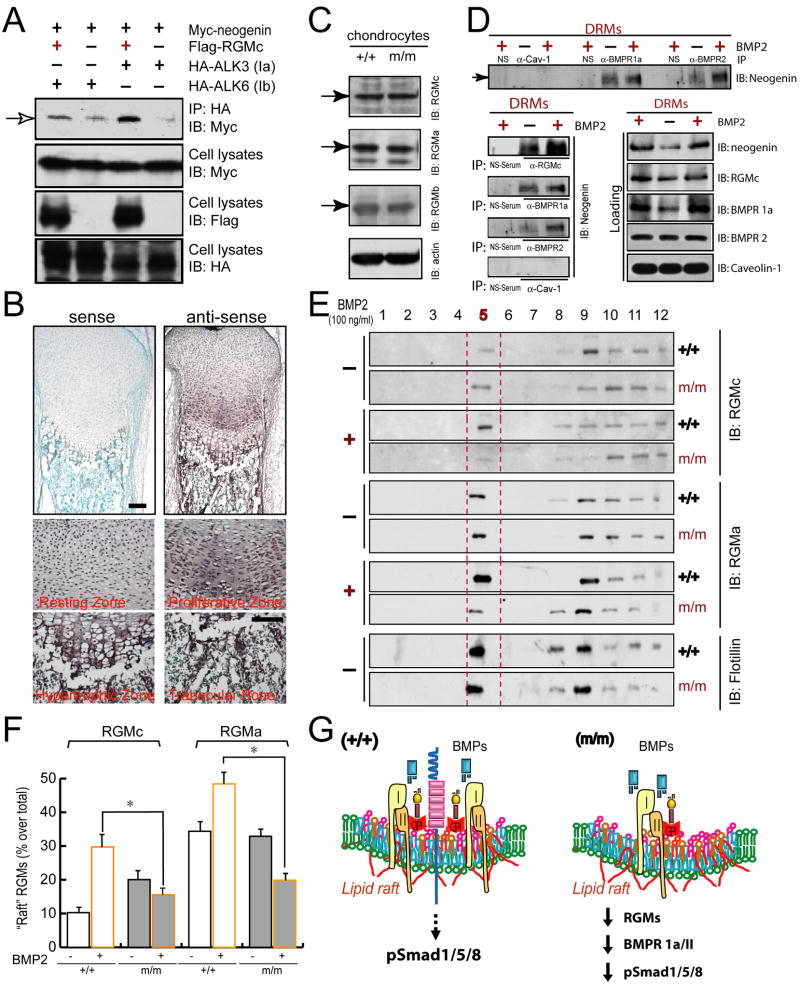
Neogenin has been identified as a receptor for the neuronal axon guidance cues netrins and RGMs (repulsive guidance molecules). Here we provide evidence for neogenin in regulating endochondral bone development and BMP (bone morphogenetic protein) signaling. Neogenin-deficient mice were impaired in digit/limb development and endochondral ossification. BMP2 induction of Smad1/5/8 phosphorylation and Runx2 expression, but not noncanonical p38 MAPK activation, was reduced in chondrocytes from neogenin mutant mice. BMP receptor association with membrane microdomains, which is necessary for BMP signaling to Smad, but not p38 MAPK, was diminished in neogenin-deficient chondrocytes. Furthermore, RGMs appear to mediate neogenin interaction with BMP receptors in chondrocytes. Taken together, our results indicate that neogenin promotes chondrogenesis in vitro and in vivo, revealing an unexpected mechanism underlying neogenin regulation of BMP signaling.


Figures

Figure 1
Figure 1. Neogenin expression in P1 growth plates and impaired endochondral bone formation in neogenin deficient mice
(A) Illustration of endochondral ossification displayed layered structure. (B) Immunohistochemical staining analysis of neogenin distribution in cartilage. The radius sections of newborn wild type mice were incubated with anti-neogenin or non-specific IgG antibodies and visualized by DAB. Bar, 120 μm. (C) Western blot analysis of lysates from wild type and neogenin mutant chondrocytes using indicated antibodies. (D) Lac Z activity in cartilage of neogeninm\m and +/m mice, in comparison with immunohistochemical staining analysis of neogenin. The growth plates of distal ulnas from new bore mice with indicated genotype were examined. Each layer structures were indicated. Neogenin was highly expressed in hypertrophic chondrocytes and osteoblasts of the trabecular bone. Bar, 10 μm. (E) Chondrogenesis and bone development examined by hematoxylin/eosin and alcian blue/von Kossa staining in ulna sections of wild-type and neogenin mutant littermates at age of P1. Higher power images of each layer were shown in (F). Note that an increased pre- and hypertrophic chondrocyte zones, reduced bone matrix and mineralization (E, star), and decreased trabecular bone volume (F, arrow) were demonstrated. The bone collar formation was not affected (E, asterisk). Quantitative analysis of bone lengths was shown in (G). The length of pre- and hypertrophic zone over total was significantly increased in mutant growth plates (*, P < 0.05, significant difference from wild type control).
Figure 2
Figure 2. Reduction of chondrocyte proliferation and apoptosis and decrease of blood vessel invasion and osteoblast function in neogenin deficient growth plates
(A–B) Decreased blood vessel invasion in neogenin mutant mice, revealed by immunofluorescence staining analysis of PECAM, a marker for angiogenesis. (C–D) Reduced bone matrix deposition in neogenin mutant mice, viewed by anti-collagen X immunostaining. (E–F) Decreased apoptosis at chondro-osseu junction in neogenin mutant mice, revealed by TUNEL analysis. The nuclei were stained with PI (red). In A-F, immunofluorescence staining or TUNEL analyses were carried out in ulna sections of new born mice. Confocal images were shown in (A, C, E), and quantitative analyses of the percentage of positive stained cells (over total cells in the indicated area) were illustrated in (B, D, F). Data shown were mean +/− SEM, n=3; **, p<0.01, significant difference from wild type control. (G–H) Chondrocyte proliferation revealed by immunohistochemical staining analysis of PCNA, a marker for cell proliferation, in ulna sections of P3 mice. DAB images were shown in (G), and quantification analysis of the percentage of positive stained cells (over total cells in the indicated proliferative zone) was shown in (H). Data shown were mean +/− SEM, n=3; *, p<0.05, significant difference from wild type control. Bar, 120 μm.
Figure 3
Figure 3. Defective chondrogenesis in vitro in cells from neogenin deficient mice
Western blot (A) and immunostaining (B) analyses of neogenin expression in wild type (+/+) and mutant (m/m) chondrocytes. Neogenin was detected in wild type, but not mutant, chondrocytes, demonstrating the specificity. Bar, 5 μm. (C) Reduced In vitro chondrocyte differentiation in neogenin deficient cells. Chondrocytes from new born wild type and mutant mice were incubated with differentiation medium (DM, growth medium supplemented with 10 mM β-glyceriophosphate and 50 μg/ml ascorbic acid) for indicated days. Cells were stained with alcian blue to view chondrocyte matrix, a differentiation marker. Bar, 50 μm. (D–F) Real time PCR analysis of genes associated with chondrocyte proliferation and/or differentiation (D), different transcriptional factors known to be important for chondrocyte differentiation (E), and BMP downstream target genes (F) was shown. In (D–F), chondrocytes isolated from new born mice were cultured in the presence of growth medium (GM) or differentiation medium (DM) for 24 hours. RNAs were isolated for real time PCR analysis as described in the Methods. Date were normalized by internal control of GAPDH, and presented as fold over wild type control (mean +/− SD, n = 6); * denoted p<0.05, significant difference from wild type control.
Figure 4
Figure 4. Reduction of Smad1/5/8, but not p38 MAPK, phosphorylation and decreased Runx2 expression in neogenin deficient chondrocytes in response to BMP2
(A) Decreased BMP2 induced p-Smad1/5/8, but not p-p38 MAPK, in chondrocytes from neogenin mutant mice. Chondrocytes from neogenin+/+ and m/m mice were serum starved for overnight, then stimulated with BMP2 (100 ng/ml) for the indicated time. Cell lysates were analyzed by Western blotting using indicated antibodies. (B-C) Quantitative analysis of data from (A). Phosphorylation of Smad1/5/8 and p38 MAPKwere normalized by total Smad1 and p38 respectively, and quantified by Image J software. Data shown were mean +/− SD, n=3; *, p<0.05, in comparison with control. (D–E) Normal TGF-β and FGF signaling in neogenin deficient chondrocytes. Serum starved chondrocytes were treated with 50 ng/ml TGF-β (D) or 10 ng/ml FGF2 (E) for the indicated time. (F) Reduction of BMP2 induced Runx2 expression in neogenin mutant chondrocytes, which was revealed by real time PCR analysis. Chondrocytes from the wild type and mutant littermates were treated with BMP2 (100 ng/ml) for 2 days. Runx2 transcripts were analyzed by real time PCR and normalized by internal control GAPDH. Data shown were fold over wild type control (mean +/− SD) from 3 independent experiments with duplicate or triplicate samples each; *, p<0.05, significant difference from the wild type control. (G) Rescue of defective BMP reporter expression by neogenin. Wild type and neogenin mutant chondrocytes were transiently transfected vector (control) or neogenin with BMP signaling reporter plasmid (9XSBE-Luc). Transfected cells were stimulated with BMP2 (100 ng/ml). Luciferase activity was normalized and presented as mean +/− S.D. of triplicates from a representative experiment. *, P < 0.05, in comparison with the absence of BMP stimulation. (H) Decreased p-Smad1/5/8 in neogenin mutant growth plates. Cartilage lysates derived from wild type (+/+) and neogenin mutant (m/m) mice at P1 were subjected for Western blot analysis using indicated antibodies. (I) Illustration of a working model for neogenin regulation of BMP signaling and function.
Figure 5
Figure 5. In vitro rescue of defective BMP signaling and function in neogenin deficient cells by high doses of BMP2
(A–B) Decreased p-Smad1/5/8 was only observed in neogenin mutant chondrocytes in response to low, but not high, doses of BMP2. Chondrocytes from neogenin+/+ and m/m mice were serum starved for overnight, then stimulated with indicated doses of BMP2 for 30 min. Data from (A) were quantified by Image J software, normalized by total Smad1, and presented in (B) as fold over wild type control (BMP2, 5 ng/ml)(mean +/− SD, n=3). (C–F) Defective in vitro chondrocyte differentiation in neogenin mutant cells was rescued by high dose of BMP2 (D), but not low dose of BMP2 (C) or netrin-1(E). Chondrocytes from new born wild type and neogenin mutant mice were incubated with the differentiation medium without or with indicated doses of BMP2 or netrin-1 for indicated days. Chondrocyte differentiation was revealed by alcian blue staining. Images were shown in (C-E), and quantification analyses of data from (C–E, day 7) were illustrated in (F). OD620 values over the wild type control were presented (mean +/− SEM, n=3). *, P < 0.05, significant difference from wild type.
Figure 6
Figure 6. Requirement of neogenin for BMP-induced of BMP receptor association with lipid rafts
(A) Abolished lipid raft association of BMP receptors (Ia and II) in neogenin mutant chondrocytes in response to BMP2. Primary cultured chondrocytes were treated with or without 100 ng/ml BMP2 for 60 min. Cell lysates were subjected to ultracentrifuge analysis and collected as 12 fractions. Each fraction was analyzed by Western blotting using indicated antibodies. Fraction 5 (between the red dot lines) was considered as lipid raft fraction, as flotinin, a marker of lipid rafts, was enriched in this fraction. (B–D) Data from (A) were quantified by Image J software and presented as percentage of raft fraction over total fractions (mean +/− SEM, n=3). *, p<0.01, in comparison with control. (E–F) Neogenin association with lipid raft fraction in wild type chondrocytes stimulated with BMP2. Western blots were shown in (E) and quantification analysis of data was illustrated in (F). Data shown was percentage of raft fraction over total fractions (mean +/− SEM, n=3). *, p<0.01, in comparison with control.
Figure 7
Figure 7. Requirement of lipid raft association of BMP receptors for BMP induction of Smad1/5/8, but not p38 MAPK, phosphorylation and chondrocyte differentiation
(A) Depletion of cholesterol by MCD treatment suppressed phosphorylation of Smad1/5/8, not p38. Primary cultured chondrocytes were pretreated with 5mM MCD for 18 hrs, followed by BMP2 (100ng/ml) stimulation for indicated time. Cell lysates were collected and subjected for Western Blotting analysis using anti-pSmad1/5/8 and p-p38 MAPK antibodies. Stripped membranes were re-blotted with antibodies against Smad1, p38 MAPK and β-actin to indicate equal amount of loading. (B–C) Quantitative analysis of results from (A). Phosphorylation of Smad1/5/8 and p38 were quantified by Image J software and normalized by Smad1 and P38 respectively. Data shown were mean +/− SEM, n=3, *, p<0.05, in comparison with control. (D) Chondrocyte differentiation was attenuated by lipid raft disruption by MCD. Primary cultured chondrocytes were cultured in chondrocyte differentiation medium together with or without MCD for indicated times. Chondrocyte differentiation was evaluated by alcian blue staining.
Figure 8
Figure 8. RGM, a linker of neogenin with BMP receptors, in lipid rafts of chondrocytes
(A) Coimmunoprecipitation analysis of neogenin with BMP receptors in HEK293 cells. Lysates of HEK 293 cells expressing indicated proteins were immunoprecipidated with anti-HA (for BMP receptors) antibody. The resulting immunoprecipitates were subjected for Western blot analysis using anti-Myc antibody (for neogenin). Loading lysates expressing indicated proteins were revealed by Western blot analyses with indicated antibodies (bottom panels). (B) In situ hybridization analysis of RGMc expression in growth plates of P1 distal ulnas. Bar, 150 μm. High-magnification views of each layer structures were shown in bottom panels. RGMc was highly expressed in proliferative and hypertrophic chondrocytes and osteoblasts of the trabecular bone. Bar, 10 μm. (C) Western blot analysis of RGMs (a, b, and c) expression in chondrocytes from wild type and neogenin mutant mice. (D) Coimmunoprecipitation analysis of neogenin with BMPR1a and BMPR2 in chondrocytes. Chondrocytes were stimulated with or without BMP2 (100 ng/ml, 30 min). Cells were lysed with 1% Triton X-100 containing buffer. Lysates were subjected to the ultracentrifuge for isolation of DRM (enriched in lipid rafts) fractions by sucrose gradient as described in Supplemental Experimental Procedures. The membrane proteins isolated from DRM fractions were used for immunoprecipidation and immunoblotting analyses with indicated antibodies (see Supplemental Experimental Procedures). Loading lysates were shown on the bottom right panels, and spliced IP data from the same SDS gel/blot were re-shown in bottom left panels. (E) Reduced lipid raft association of RGMs (a and c) in neogenin mutant chondrocytes stimulated with BMP2. Chondrocytes from wild type(+/+) and neogenin mutant (m/m) mice were treated with or without 100 ng/ml BMP2 for 60 min. Cell lysates were subjected for lipid raft isolation as described in Fig. 6. The resulting 12 fractions were subjected to Western blot analyses with indicated antibodies. (F) Data from (E) were quantified by Image J software and presented as percentage of raft fraction over total fractions (mean +/− SEM, n=3). *, p<0.05, in comparison with wild type control. (G) A diagram illustrating the model for RGMs in bridging neogenin with BMP receptors at the lipid raft in response to BMP stimulation, where p-Smad1/5/8 is activated. In neognein mutant chondrocytes, reduced RGMs and BMP receptors were found in the lipid raft. Thus, a reduced p-Smad1/5/8 signaling and function was observed.

Comment in

References

    1. Babitt JL, Huang FW, Wrighting DM, Xia Y, Sidis Y, Samad TA, Campagna JA, Chung RT, Schneyer AL, Woolf CJ, et al. Bone morphogenetic protein signaling by hemojuvelin regulates hepcidin expression. Nature genetics. 2006;38:531–539. - PubMed
    1. Babitt JL, Zhang Y, Samad TA, Xia Y, Tang J, Campagna JA, Schneyer AL, Woolf CJ, Lin HY. Repulsive guidance molecule (RGMa), a DRAGON homologue, is a bone morphogenetic protein co-receptor. The Journal of biological chemistry. 2005;280:29820–29827. - PubMed
    1. Baur ST, Mai JJ, Dymecki SM. Combinatorial signaling through BMP receptor IB and GDF5: shaping of the distal mouse limb and the genetics of distal limb diversity. Development (Cambridge, England) 2000;127:605–619. - PubMed
    1. Chen M, Zhu M, Awad H, Li TF, Sheu TJ, Boyce BF, Chen D, O’Keefe RJ. Inhibition of beta-catenin signaling causes defects in postnatal cartilage development. Journal of cell science. 2008;121:1455–1465. - PMC - PubMed
    1. Cole SJ, Bradford D, Cooper HM. Neogenin: A multi-functional receptor regulating diverse developmental processes. The international journal of biochemistry & cell biology. 2007;39:1569–1575. - PubMed

Publication types

MeSH terms