Comparative Study
. 2010 Dec;29(12):2023-37.
doi: 10.1109/TMI.2010.2058861. Epub 2010 Jul 19.

LOGISMOS--layered optimal graph image segmentation of multiple objects and surfaces: cartilage segmentation in the knee joint

Affiliations
Comparative Study

LOGISMOS--layered optimal graph image segmentation of multiple objects and surfaces: cartilage segmentation in the knee joint

Yin Yin et al. IEEE Trans Med Imaging. 2010 Dec.

Abstract

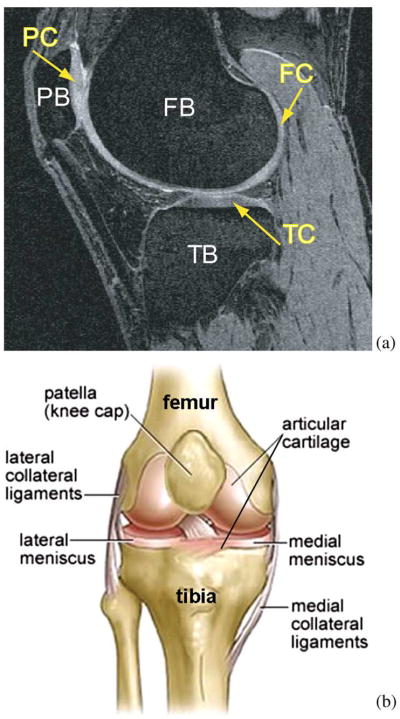
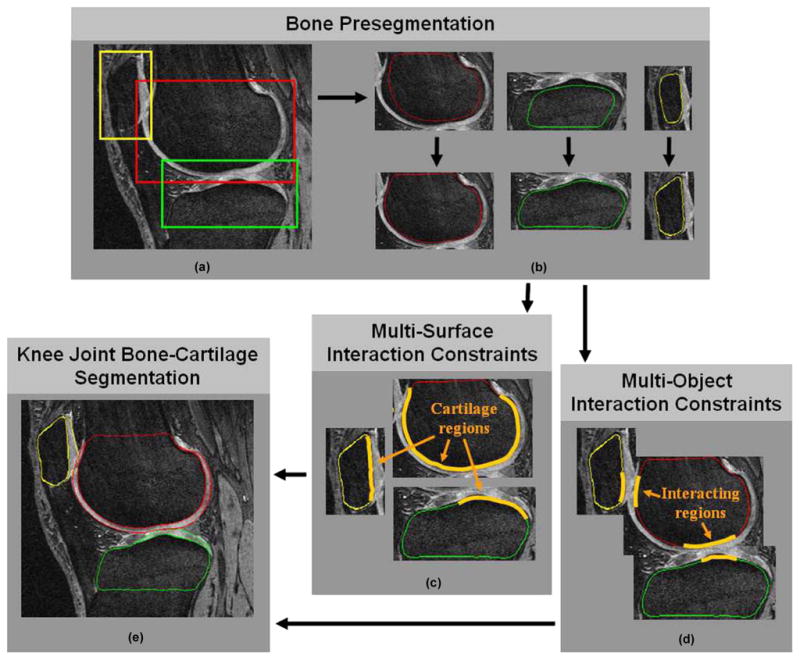
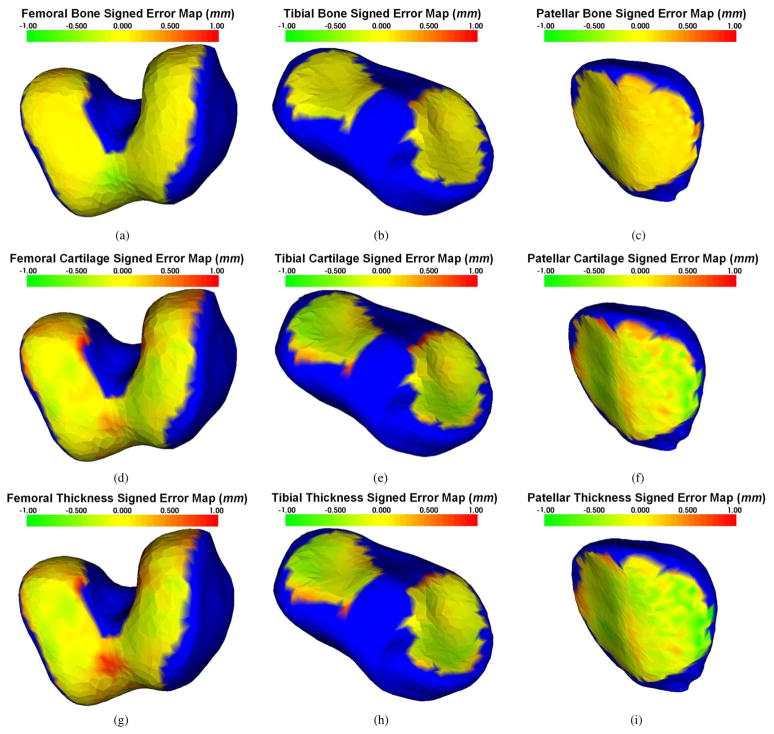
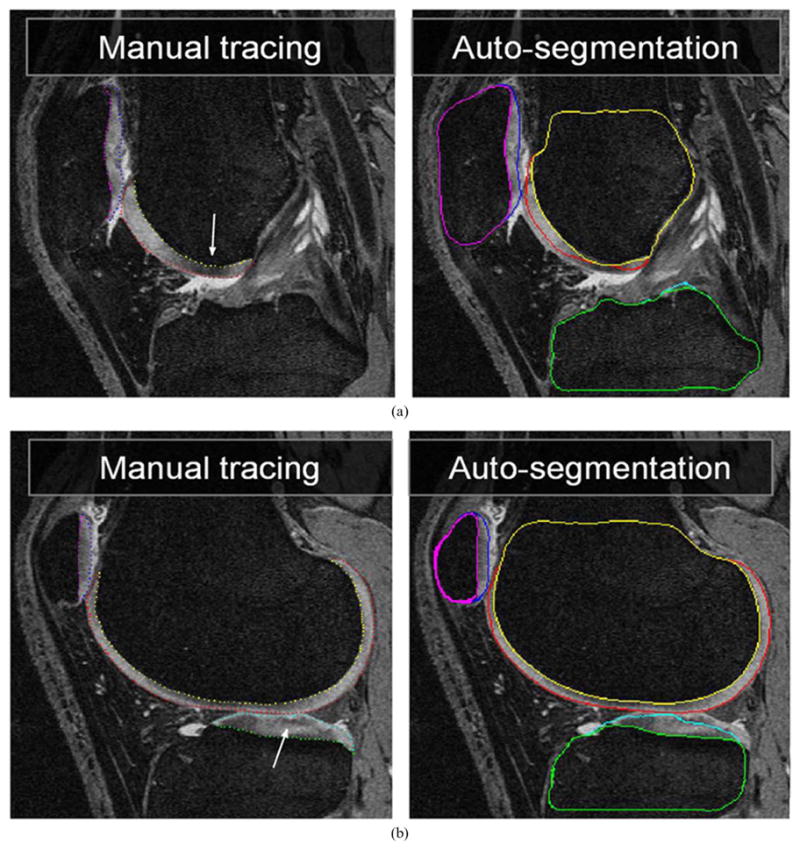
A novel method for simultaneous segmentation of multiple interacting surfaces belonging to multiple interacting objects, called LOGISMOS (layered optimal graph image segmentation of multiple objects and surfaces), is reported. The approach is based on the algorithmic incorporation of multiple spatial inter-relationships in a single n-dimensional graph, followed by graph optimization that yields a globally optimal solution. The LOGISMOS method's utility and performance are demonstrated on a bone and cartilage segmentation task in the human knee joint. Although trained on only a relatively small number of nine example images, this system achieved good performance. Judged by dice similarity coefficients (DSC) using a leave-one-out test, DSC values of 0.84 ± 0.04, 0.80 ± 0.04 and 0.80 ± 0.04 were obtained for the femoral, tibial, and patellar cartilage regions, respectively. These are excellent DSC values, considering the narrow-sheet character of the cartilage regions. Similarly, low signed mean cartilage thickness errors were obtained when compared to a manually-traced independent standard in 60 randomly selected 3-D MR image datasets from the Osteoarthritis Initiative database-0.11 ± 0.24, 0.05 ± 0.23, and 0.03 ± 0.17 mm for the femoral, tibial, and patellar cartilage thickness, respectively. The average signed surface positioning errors for the six detected surfaces ranged from 0.04 ± 0.12 mm to 0.16 ± 0.22 mm. The reported LOGISMOS framework provides robust and accurate segmentation of the knee joint bone and cartilage surfaces of the femur, tibia, and patella. As a general segmentation tool, the developed framework can be applied to a broad range of multiobject multisurface segmentation problems.


Figures

Fig. 1
Fig. 1
Human knee. (a) Example MR image of a knee joint—femur, patella, and tibia bones with associated cartilage surfaces are clearly visible. FB = femoral bone, TB = tibial bone, PB = patellar bone, FC = femoral cartilage, TC = tibial cartilage, PC = patellar cartilage. (b) Schematic view of knee anatomy (adapted from http://www.ACLSolutions.com).
Fig. 2
Fig. 2
The process of converting finding V-weight net formula image 
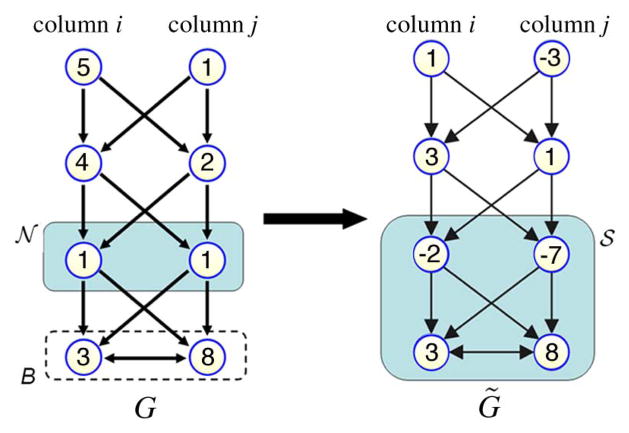
in G problem into finding nonempty closed set formula image in with the same weight. Here K = 4.
Fig. 3
Fig. 3
Cross-object surface mapping by ELF (a) The ELF (blue lines) are pushed forward from a surface composed of black vertices. The dashed black surfaces indicate the location of iso-electric-potential contours. The red-dashed ELF is the traced-back line from a green point to the solid black surface. The traced-back line is computed by interpolating two neighboring pushed-forward ELF. (b) Constraint-point mapping of coupled 3-D surfaces is performed in the following 5 steps: i) Green and red ELF are pushed forward from surface 1 and 2, respectively. ii) The intersections between the ELF and medial separating sheet form a blue triangle and a red point. iii) The red point is traced back along dotted red line to surface 1. iv) When the dotted red line intersects surface 1, it forms a light-blue constraint point on surface 1. v) The constraint point is connected at surface 1 by yellow edges.
Fig. 4
Fig. 4
The flowchart of LOGISMOS based segmentation of articular cartilage for all bones in the knee joint. (a) Detection of bone volumes of interest using Adaboost approach. (b) Approximate bone segmentation using single-surface graph search. (c) Generation of multisurface interaction constraints. (d) Construction of multiobject interaction constraints. (e) LOGISMOS-based simultaneous segmentation of six bone and cartilage surfaces in 3-D.
Fig. 5
Fig. 5
Summary of classifier-learning stages of LOGISMOS based segmentation of articular cartilage for all bones in the knee joint. A total of 12 classifiers was trained and utilized. Complete expert-defined VOIs are available for TRAIN-1 (25 MR images). Complete tracings of bone and cartilage surfaces are available for TRAIN-2 (9 MR images) dataset. Note that individual steps are separately validated. The TEST dataset is large and consists of 60 MR datasets, for which dense but not complete tracing of bone and cartilage surfaces is available. (a) Learning of VOI properties in TRAIN-1 dataset, Adaboost localization of individual bones VOIs, leave-one-out validation in TRAIN-1. (b) Learning of bone surface properties in TRAIN-2 dataset, leave-one-out validation in TRAIN-2. (c) Learning of cartilage/non-cartilage location properties in TRAIN-2 dataset, Adaboost classification of cartilage/non-cartilage regions, (also leave-one-out validation in TRAIN-2). (d) Learning cartilage regional properties in TRAIN-2 dataset, final validation in TEST dataset, (also leave-one-out validation in TRAIN-2).
Fig. 6
Fig. 6
Nine types of 3-D Haar features, employed in a multiscale manner.
Fig. 7
Fig. 7
MR image segmentation of a knee joint—a single contact-area slice from a 3-D MR dataset is shown. Segmentation of all six surfaces was performed simultaneously in 3-D. (left) Original image data with expert-tracing overlaid. (right) Computer segmentation result. Note that the double-line boundary of tibial bone is caused by intersecting the segmented 3-D surface with the image plane.
Fig. 8
Fig. 8
3-D segmentation of knee cartilages. Images from a knee minimally affected by osteoarthritis shown on the left. Severe cartilage degeneration shown on the right. (a), (b) Original images. (c), (d) The same slice with bone/cartilage segmentation. (e), (f) Cartilage segmentation shown in 3-D, note the cartilage thinning and “holes” in panel (f).
Fig. 9
Fig. 9
Distribution of mean signed surface positioning errors superimposed on mean shapes of the three bones forming the knee joint. In all panels, blue color corresponds to bone areas not covered by cartilage when mapped to mean shape. The range of colors from green to red corresponds to surface positioning errors ranging from −1 to +1 mm. Panels (a)–(c) show bone surface positioning errors, (d)–(f) show cartilage surface positioning errors, and (g)–(i) mean signed errors of computed cartilage thickness. Note that the yellowish color corresponds with zero error, visually demonstrating only a small systematic segmentation and thickness assessment bias across all cartilage regions.
Fig. 10
Fig. 10
Worst TEST-set segmentation case. Two MR image slices from the 3-D volume shown with expert contours (left panels). Computer segmentation result shows local inaccuracies caused by signal void regions in the femoral and tibial cartilages, marked by arrows and by unexpectedly large cartilage thickness that has not appeared in the training set.

Similar articles

Cited by

References

    1. Sonka M, Hlavac V, Boyle R. Image Processing, Analysis, and Machine Vision. 3. Mobile, AL: Thomson Eng; 2008.
    1. Wu X, Chen DZ. Optimal net surface problem with applications. Proc. 29th Int. Coll. Automata, Lang. Program. (ICALP); Jul. 2002; pp. 1029–1042.
    1. Li K, Wu X, Chen DZ, Sonka M. Optimal surface segmentation in volumetric images—A graph-theoretic approach. IEEE Trans Pattern Anal Mach Intell. 2006 Jan;28(1):119–134. - PMC - PubMed
    1. Tsai A, Wells W, Tempany C, Grimson E, Willsky A. Mutual information in coupled multi-shape model for medical image segmentation. Med Image Anal. 2004;8:429–445. - PubMed
    1. Litvin A, Karl WC. Coupled shape distribution-based segmentation of multiple objects. Inf Process Med Imag. 2005:345–356. - PubMed

Publication types

MeSH terms