

National hospitalization trends for pediatric pneumonia and associated complications
- PMID: 20643717
- PMCID: PMC2914815
- DOI: 10.1542/peds.2009-3109
National hospitalization trends for pediatric pneumonia and associated complications
Abstract
Objective: To determine current rates of and trends in hospitalizations for community-acquired pneumonia (CAP) and CAP-associated complications among children.
Methods: We performed a cross-sectional, retrospective, cohort study by using the 1997, 2000, 2003, and 2006 Kids' Inpatient Database. National estimates for CAP and CAP-associated local and systemic complication rates were calculated for children < or =18 years of age. Patients with comorbid conditions or in-hospital birth status were excluded. Percentage changes were calculated by using 1997 (before heptavalent pneumococcal conjugate vaccine [PCV7]) and 2006 (after PCV7) data.
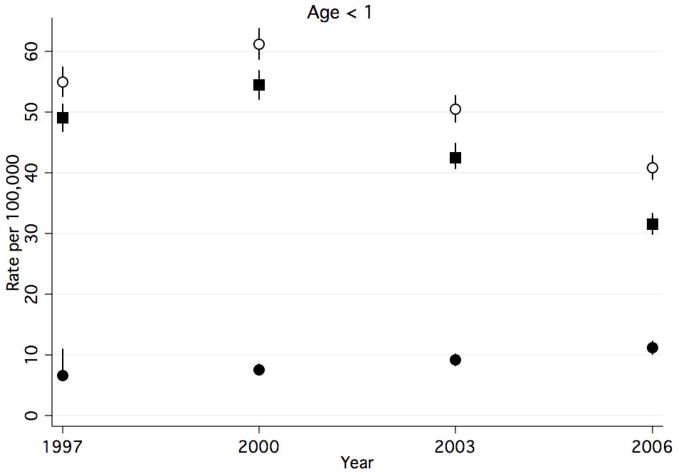
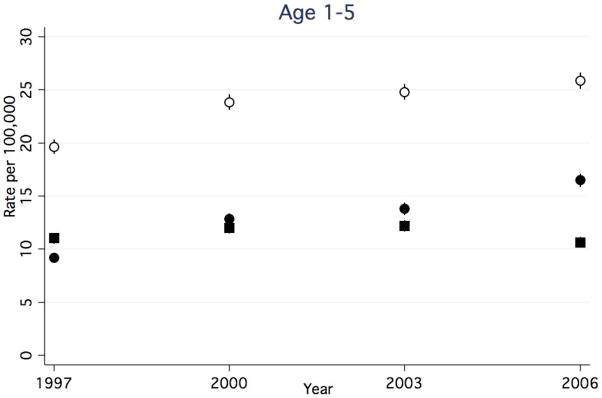
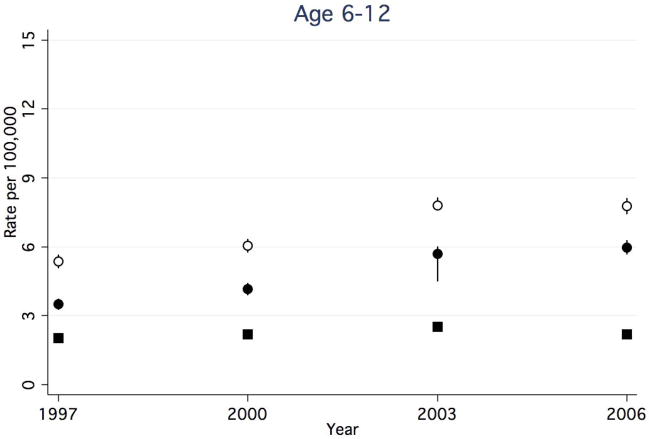
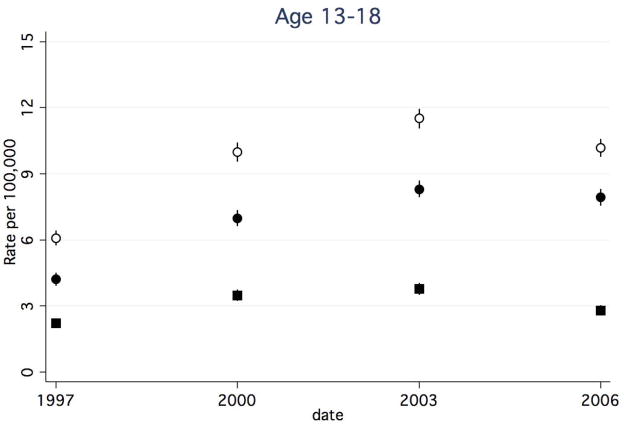
Results: There were a total of 619,102 CAP discharges for 1997, 2000, 2003, and 2006, after application of inclusion and exclusion criteria. Overall rates of CAP discharges did not change substantially between 1997 and 2006, but stratification according to age revealed a 22% decrease for children <1 year of age, minimal change for children 1 to 5 years of age, and increases for children 6 to 12 years (22%) and > or =13 years (41%) of age. Systemic complication rates were highest among children <1 year of age but decreased by 36%. In all other age groups, systemic complication rates remained stable. Local complication rates increased 78% overall. Children 1 to 5 years of age had the highest local complication rates.
Conclusions: After the introduction of PCV7 in 2000, rates of CAP-associated systemic complications decreased only for children <1 year of age. Rates of pediatric CAP-associated local complications are increasing in all age groups.
Figures
References
-
- Messina AF, Katz-Gaynor K, Barton T, et al. Impact of the pneumococcal conjugate vaccine on serotype distribution and antimicrobial resistance of invasive Streptococcus pneumoniae isolates in Dallas, TX, children from 1999 through 2005. Pediatr Infect Dis J. 2007;26:461–7. - PubMed
-
- Whitney CG, Farley MM, Hadler J, et al. Decline in invasive pneumococcal disease after the introduction of protein-polysaccharide conjugate vaccine. N Engl J Med. 2003;348:1737–46. - PubMed
-
- Kaplan SL, Mason EO, Jr, Wald ER, et al. Decrease of invasive pneumococcal infections in children among 8 children’s hospitals in the United States after the introduction of the 7-valent pneumococcal conjugate vaccine. Pediatrics. 2004;113:443–9. - PubMed
-
- Black S, Shinefield H, Baxter R, et al. Postlicensure surveillance for pneumococcal invasive disease after use of heptavalent pneumococcal conjugate vaccine in Northern California Kaiser Permanente. Pediatr Infect Dis J. 2004;23:485–9. - PubMed
-
- Hicks LA, Harrison LH, Flannery B, et al. Incidence of pneumococcal disease due to non-pneumococcal conjugate vaccine (PCV7) serotypes in the United States during the era of widespread PCV7 vaccination, 1998–2004. J Infect Dis. 2007;196:1346–54. - PubMed
Publication types
MeSH terms
Substances
Grants and funding
LinkOut - more resources
Full Text Sources
Miscellaneous
