

Adaptations to new environments in humans: the role of subtle allele frequency shifts
- PMID: 20643735
- PMCID: PMC2935101
- DOI: 10.1098/rstb.2010.0032
Adaptations to new environments in humans: the role of subtle allele frequency shifts
Abstract
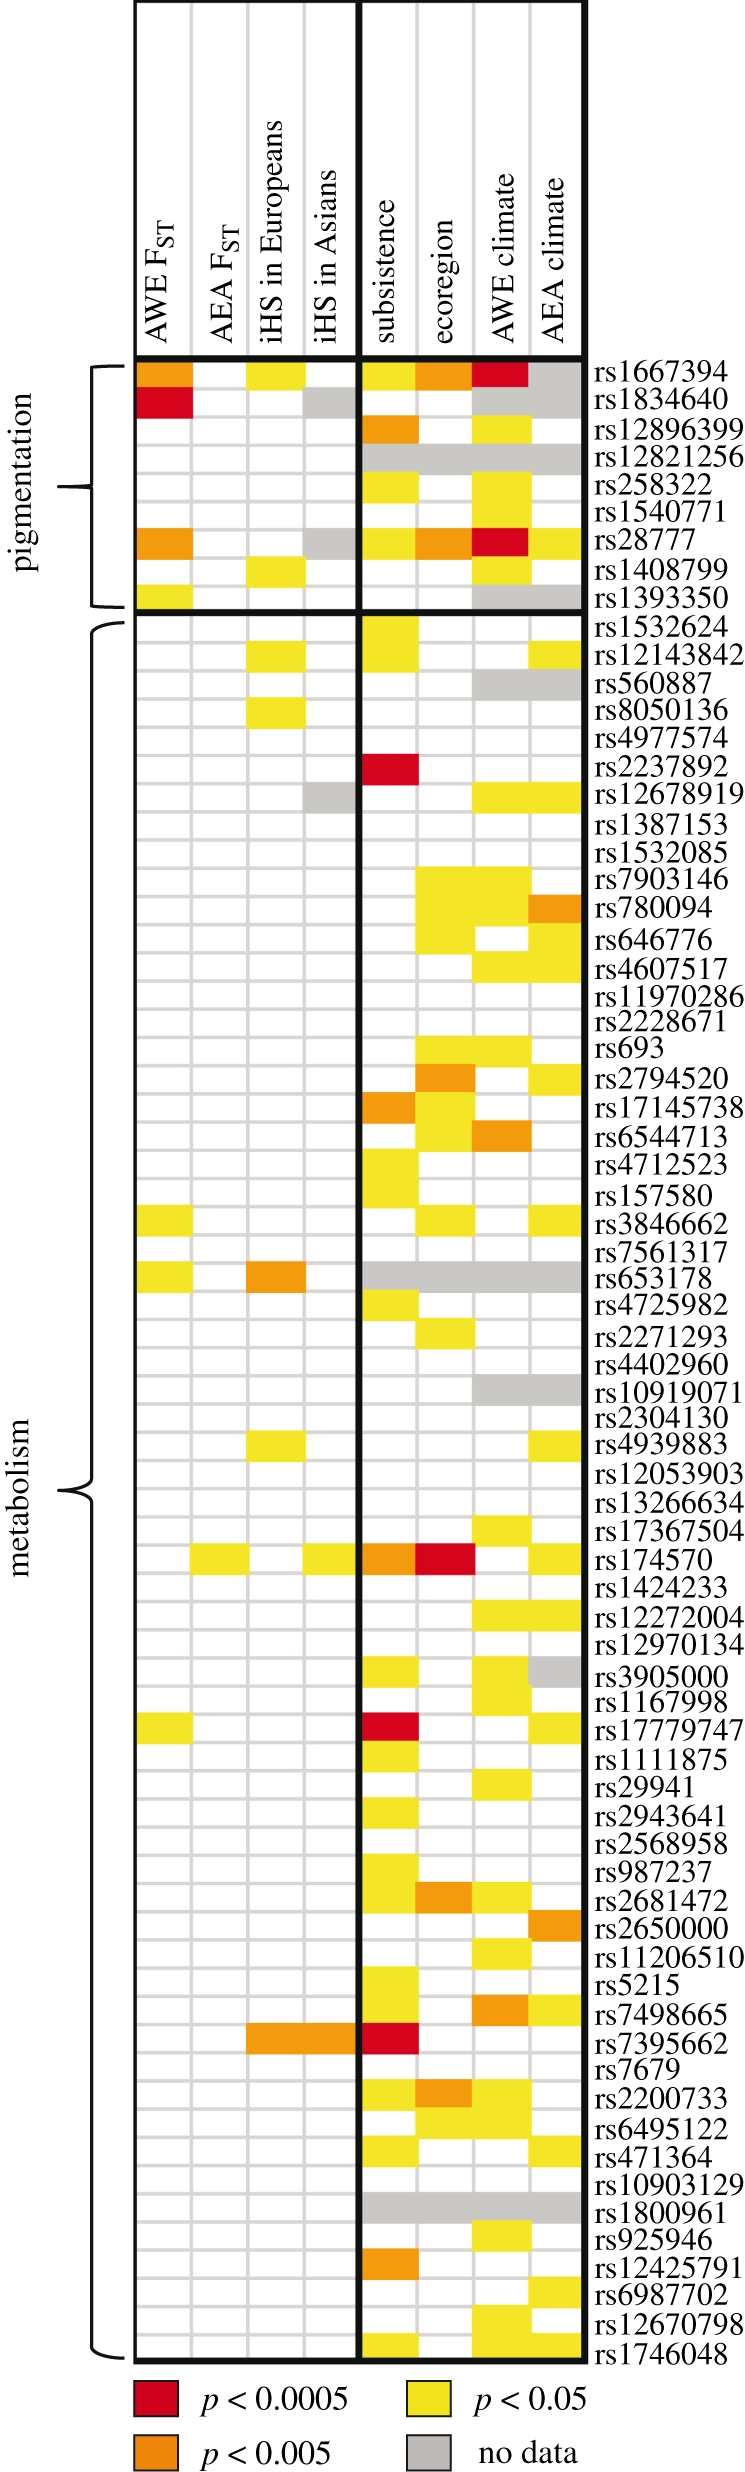
Humans show tremendous phenotypic diversity across geographically distributed populations, and much of this diversity undoubtedly results from genetic adaptations to different environmental pressures. The availability of genome-wide genetic variation data from densely sampled populations offers unprecedented opportunities for identifying the loci responsible for these adaptations and for elucidating the genetic architecture of human adaptive traits. Several approaches have been used to detect signals of selection in human populations, and these approaches differ in the assumptions they make about the underlying mode of selection. We contrast the results of approaches based on haplotype structure and differentiation of allele frequencies to those from a method for identifying single nucleotide polymorphisms strongly correlated with environmental variables. Although the first group of approaches tends to detect new beneficial alleles that were driven to high frequencies by selection, the environmental correlation approach has power to identify alleles that experienced small shifts in frequency owing to selection. We suggest that the first group of approaches tends to identify only variants with relatively strong phenotypic effects, whereas the environmental correlation methods can detect variants that make smaller contributions to an adaptive trait.
Figures


References
-
- Akey J. M., Eberle M. A., Rieder M. J., Carlson C. S., Shriver M. D., Nickerson D. A., Kruglyak L.2004Population history and natural selection shape patterns of genetic variation in 132 genes. PLoS Biol. 2, e286 (doi:10.1371/journal.pbio.0020286) - DOI - PMC - PubMed
-
- Allen J. A.1877The influence of physical conditions in the genesis of species. Rad. Rev. 1, 108–140
-
- Barreiro L. B., Laval G., Quach H., Patin E., Quintana-Murci L.2008Natural selection has driven population differentiation in modern humans. Nat. Genet. 40, 340–345 (doi:10.1038/ng.78) - DOI - PubMed
-
- Beall C.1997Andean, Tibetan, and Ethiopian patterns of adaptation to high-altitude hypoxia. Integr. Comp. Biol. 46, 18–24 (doi:10.1093/icb/icj004) - DOI - PubMed
-
- Bergmann C.1847Über die Verhältnisse der wärmeökonomie der Thiere zu ihrer Grösse. Göttinger Studien 3, 595–708
Publication types
MeSH terms
Grants and funding
LinkOut - more resources
Full Text Sources