

Review
doi: 10.1083/jcb.201002018.
Epub 2010 Jul 19.
A guide to super-resolution fluorescence microscopy
Affiliations
- PMID: 20643879
- PMCID: PMC2918923
- DOI: 10.1083/jcb.201002018
Item in Clipboard
Review
A guide to super-resolution fluorescence microscopy
J Cell Biol.
.
Abstract
For centuries, cell biology has been based on light microscopy and at the same time been limited by its optical resolution. However, several new technologies have been developed recently that bypass this limit. These new super-resolution technologies are either based on tailored illumination, nonlinear fluorophore responses, or the precise localization of single molecules. Overall, these new approaches have created unprecedented new possibilities to investigate the structure and function of cells.
Figures
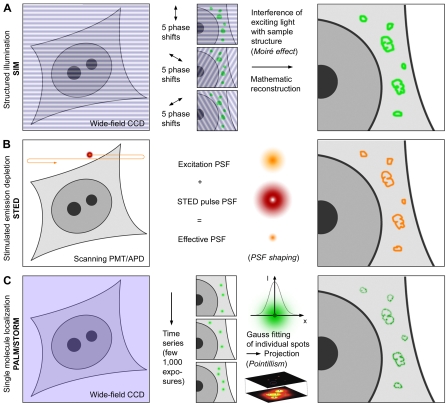
Super-resolution imaging principles. (A) In SIM the sample plane is excited by a nonuniform wide-field illumination. Laser light passes through an optical grating, which generates a stripe-shaped sinusoidal interference pattern. This combines with the sample information originating from structures below the diffraction limit to generate moiré fringes. The image detected by the CCD camera thus contains high spatial frequency sample information shifted to a lower spatial frequency band that is transmitted through the objective. A mathematical reconstruction allows, from a series of 15 raw images per slice, to reconstruct a high-resolution image with doubled resolution in xy compared with wide-field resolution. In 3D-SIM additional doubling in the axial resolution is achieved by accounting for an additional modulation introduced along the axial direction. (B) In STED microscopy the focal plane is scanned with two overlapping laser beams, typically being pulsed with a mutual time delay. While the first laser excites the fluorophores, the second longer wavelength laser drives the fluorophores back to the ground state by the process of stimulated emission. A phase plate in the light path of the depletion laser generates a donut-shaped energy distribution, leaving only a small volume from which light can be emitted that is then being detected. Thus, the PSF is shaped to a volume smaller than the diffraction limit. (C) Single molecule localization microscopy assures that only a relatively low number of fluorophores are in the emitting (active) state. This is achieved either by photoactivation, photoswitching, triplet state shelving, or blinking. These molecules are detected on the CCD camera as diffraction-limited spots, whose lateral position is determined with very high accuracy by a fit. Single molecule positions from several thousand raw images, each with a different subset of emitters, are then used to generate a density map featuring several hundred thousand single molecule positions within the plane of focus.
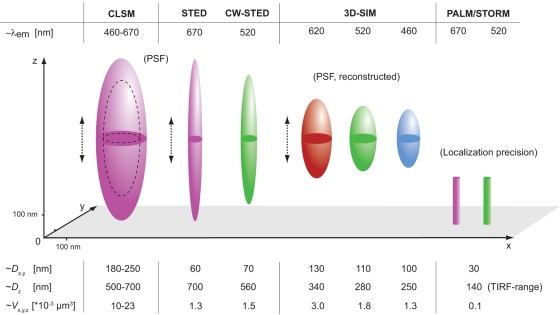
Resolvable volumes obtained with current commercial super-resolution microscopes. A schematic 3D representation of focal volumes is shown for the indicated emission maxima. The approximate lateral (x,y) and axial (z) resolution and resolvable volumes are listed. Note that STED/CW-STED and 3D-SIM can reach up to 20 µm into the sample, whereas PALM/STORM is usually confined to the evanescent wave field near the sample bottom. It should be noted that deconvolution approaches can further improve STED resolution. For comparison the “focal volume” for PALM/STORM was estimated based on the localization precision in combination with the z-range of TIRF. These indications do not necessarily constitute actual resolution as many other effects (e.g., fluorophore orientation, local refractive index variations, flatfield quality of the camera, local aberrations, and statistical selection bias) influence image quality and final resolution.
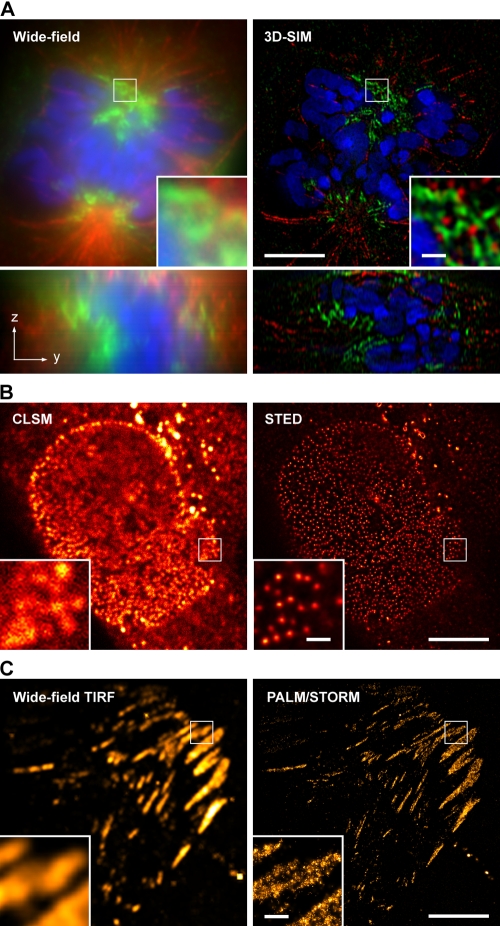
Super-resolution microscopy of biological samples. (A) Conventional wide-field image (left) and 3D-SIM image of a mouse C2C12 prometaphase cell stained with primary antibodies against lamin B and tubulin, and secondary antibodies conjugated to Alexa 488 (green) and Alexa 594 (red), respectively. Nuclear chromatin was stained with DAPI (blue). 3D image stacks were acquired with a DeltaVision OMX prototype system (Applied Precision). The bottom panel shows the respective orthogonal cross sections. (B) HeLa cell stained with primary antibodies against the nuclear pore complex protein Nup153 and secondary antibodies conjugated with ATTO647N. The image was acquired with a TCS STED confocal microscope (Leica). (C) TdEosFP-paxillin expressed in a Hep G2 cell to label adhesion complexes at the lower surface. The image was acquired on an ELYRA P.1 prototype system (Carl Zeiss, Inc.) using TIRF illumination. Single molecule positional information was projected from 10,000 frames recorded at 30 frames per second. On the left, signals were summed up to generate a TIRF image with conventional wide-field lateral resolution. Bars: 5 µm (insets, 0.5 µm).
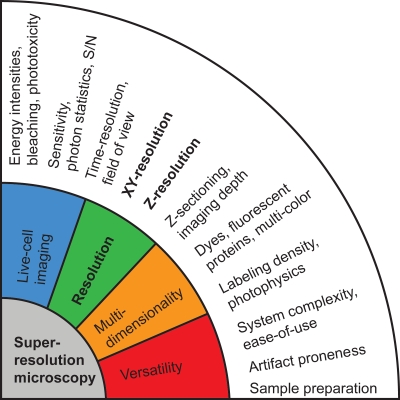
Challenges and trade-offs in super-resolution fluorescence microscopy. Although the nominal lateral (xy) and axial (z) resolution of a microscope is the most prominent system parameter, the usefulness for broader or routine application depends on a wealth of additional criteria. This includes the ability to image time series of living samples and multidimensional imaging (3D sectioning with multiple wavelength), as well as soft criteria, such as the easy applicability and the reliability of the results. Notably, none of the currently available super-resolution technologies fulfill all criteria.

References
-
- Abbe E.1873. Beiträge zur Theorie des Mikroskops und der mikroskopischen Wahrnehmung. Archiv für mikroskopische Anatomie. 9:413–418
-
- Baddeley D., Chagin V.O., Schermelleh L., Martin S., Pombo A., Carlton P.M., Gahl A., Domaing P., Birk U., Leonhardt H., et al. 2010. Measurement of replication structures at the nanometer scale using super-resolution light microscopy. Nucleic Acids Res. 38:e8 10.1093/nar/gkp901 - DOI - PMC - PubMed
Publication types
MeSH terms
Substances
LinkOut - more resources
Full Text Sources
Other Literature Sources
