

Gene expression centroids that link with low intrinsic aerobic exercise capacity and complex disease risk
- PMID: 20643908
- PMCID: PMC2974413
- DOI: 10.1096/fj.10-157313
Gene expression centroids that link with low intrinsic aerobic exercise capacity and complex disease risk
Abstract
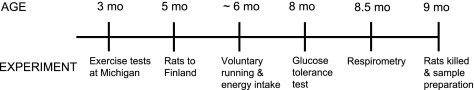
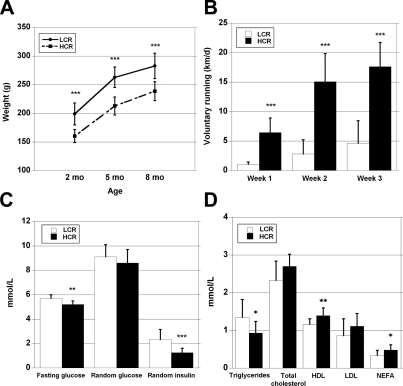
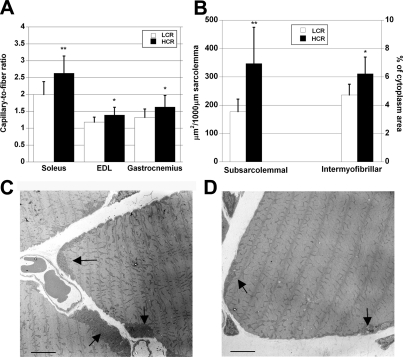
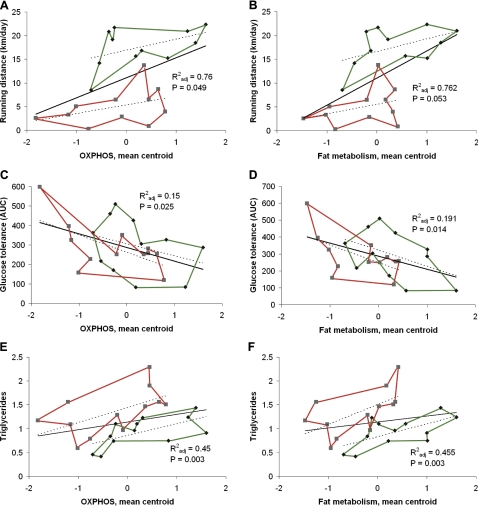
A strong link exists between low aerobic exercise capacity and complex metabolic diseases. To probe this linkage, we utilized rat models of low and high intrinsic aerobic endurance running capacity that differ also in the risk for metabolic syndrome. We investigated in skeletal muscle gene-phenotype relationships that connect aerobic endurance capacity with metabolic disease risk factors. The study compared 12 high capacity runners (HCRs) and 12 low capacity runners (LCRs) from generation 18 of selection that differed by 615% for maximal treadmill endurance running capacity. On average, LCRs were heavier and had increased blood glucose, insulin, and triglycerides compared with HCRs. HCRs were higher for resting metabolic rate, voluntary activity, serum high density lipoproteins, muscle capillarity, and mitochondrial area. Bioinformatic analysis of skeletal muscle gene expression data revealed that many genes up-regulated in HCRs were related to oxidative energy metabolism. Seven mean mRNA expression centroids, including oxidative phosphorylation and fatty acid metabolism, correlated significantly with several exercise capacity and disease risk phenotypes. These expression-phenotype correlations, together with diminished skeletal muscle capillarity and mitochondrial area in LCR rats, support the general hypothesis that an inherited intrinsic aerobic capacity can underlie disease risks.
Figures

Similar articles
-
Voluntary Running Aids to Maintain High Body Temperature in Rats Bred for High Aerobic Capacity.Front Physiol. 2016 Jul 25;7:311. doi: 10.3389/fphys.2016.00311. eCollection 2016. Front Physiol. 2016. PMID: 27504097 Free PMC article.
-
Intrinsic aerobic capacity correlates with greater inherent mitochondrial oxidative and H2O2 emission capacities without major shifts in myosin heavy chain isoform.J Appl Physiol (1985). 2012 Nov;113(10):1624-34. doi: 10.1152/japplphysiol.01475.2011. Epub 2012 Sep 20. J Appl Physiol (1985). 2012. PMID: 22995392 Free PMC article.
-
Rats bred for low aerobic capacity become promptly fatigued and have slow metabolic recovery after stimulated, maximal muscle contractions.PLoS One. 2012;7(11):e48345. doi: 10.1371/journal.pone.0048345. Epub 2012 Nov 20. PLoS One. 2012. PMID: 23185253 Free PMC article.
-
Theoretical and Biological Evaluation of the Link between Low Exercise Capacity and Disease Risk.Cold Spring Harb Perspect Med. 2018 Jan 2;8(1):a029868. doi: 10.1101/cshperspect.a029868. Cold Spring Harb Perspect Med. 2018. PMID: 28389512 Free PMC article. Review.
-
Systemic oxygen transport in rats artificially selected for running endurance.Respir Physiol Neurobiol. 2006 Apr 28;151(2-3):141-50. doi: 10.1016/j.resp.2005.09.012. Epub 2005 Dec 15. Respir Physiol Neurobiol. 2006. PMID: 16344008 Review.
Cited by
-
Voluntary Running Aids to Maintain High Body Temperature in Rats Bred for High Aerobic Capacity.Front Physiol. 2016 Jul 25;7:311. doi: 10.3389/fphys.2016.00311. eCollection 2016. Front Physiol. 2016. PMID: 27504097 Free PMC article.
-
Enhanced cardiac protein glycosylation (O-GlcNAc) of selected mitochondrial proteins in rats artificially selected for low running capacity.Physiol Genomics. 2013 Jan 7;45(1):17-25. doi: 10.1152/physiolgenomics.00111.2012. Epub 2012 Nov 6. Physiol Genomics. 2013. PMID: 23132757 Free PMC article.
-
Parental cardiorespiratory fitness influences early life energetics and metabolic health.Physiol Genomics. 2024 Feb 1;56(2):145-157. doi: 10.1152/physiolgenomics.00045.2023. Epub 2023 Nov 27. Physiol Genomics. 2024. PMID: 38009224 Free PMC article.
-
Maximal oxidative capacity during exercise is associated with skeletal muscle fuel selection and dynamic changes in mitochondrial protein acetylation.Cell Metab. 2015 Mar 3;21(3):468-78. doi: 10.1016/j.cmet.2015.02.007. Cell Metab. 2015. PMID: 25738461 Free PMC article.
-
Selection-, age-, and exercise-dependence of skeletal muscle gene expression patterns in a rat model of metabolic fitness.Physiol Genomics. 2016 Nov 1;48(11):816-825. doi: 10.1152/physiolgenomics.00118.2015. Epub 2016 Sep 16. Physiol Genomics. 2016. PMID: 27637250 Free PMC article.
References
-
- Kokkinos P., Myers J., Kokkinos J. P., Pittaras A., Narayan P., Manolis A., Karasik P., Greenberg M., Papademetriou V., Singh S. (2008) Exercise capacity and mortality in black and white men. Circulation 117, 614– 622 - PubMed
-
- Newman A. B., Simonsick E. M., Naydeck B. L., Boudreau R. M., Kritchevsky S. B., Nevitt M. C., Pahor M., Satterfield S., Brach J. S., Studenski S. A., Harris T. B. (2006) Association of long-distance corridor walk performance with mortality, cardiovascular disease, mobility limitation, and disability. JAMA 295, 2018– 2026 - PubMed
-
- Bray M. S., Hagberg J. M., Perusse L., Rankinen T., Roth S. M., Wolfarth B., Bouchard C. (2009) The human gene map for performance and health-related fitness phenotypes: The 2006–2007 update. Med. Sci. Sports Exerc. 41, 35– 73 - PubMed
-
- Koch L. G., Britton S. L. (2001) Artificial selection for intrinsic aerobic endurance running capacity in rats. Physiol. Genomics 5, 45– 52 - PubMed
-
- Jeong H., Tombor B., Albert R., Oltvai Z. N., Barabasi A. L. (2000) The large-scale organization of metabolic networks. Nature 407, 651– 654 - PubMed
Publication types
MeSH terms
Substances
Associated data
- Actions
Grants and funding
LinkOut - more resources
Full Text Sources
Medical
Molecular Biology Databases
