. 2010 Aug 3;107(31):13614-9.
doi: 10.1073/pnas.1003600107. Epub 2010 Jul 19.

Osteoinductive ceramics as a synthetic alternative to autologous bone grafting

Affiliations

Osteoinductive ceramics as a synthetic alternative to autologous bone grafting

Huipin Yuan et al. Proc Natl Acad Sci U S A. .

Abstract

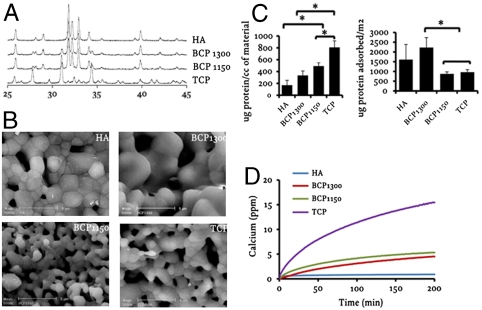
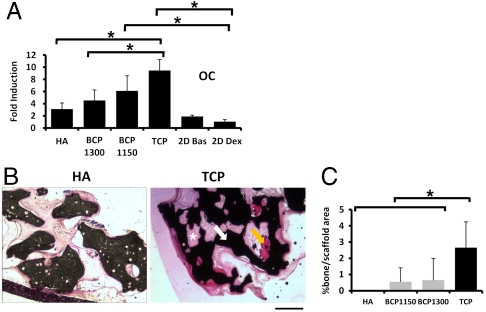
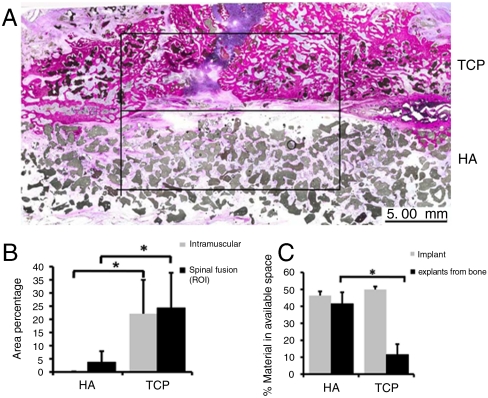
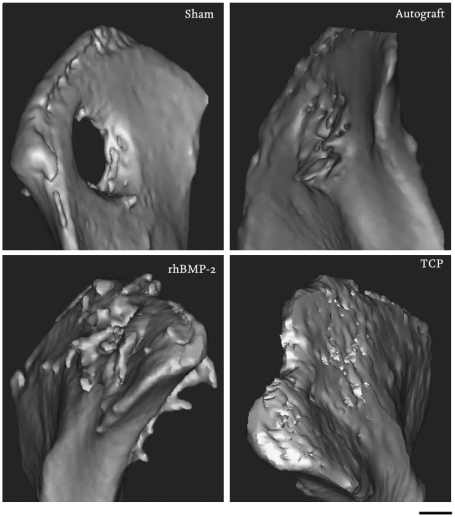
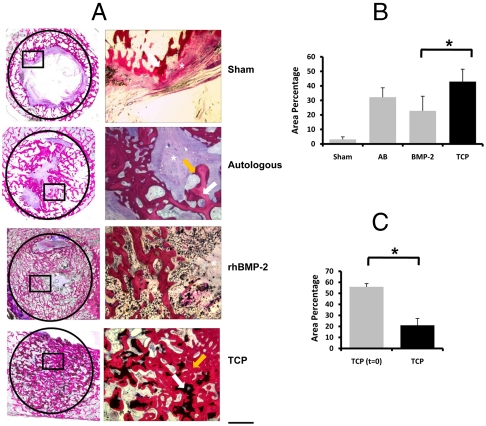
Biomaterials can be endowed with biologically instructive properties by changing basic parameters such as elasticity and surface texture. However, translation from in vitro proof of concept to clinical application is largely missing. Porous calcium phosphate ceramics are used to treat small bone defects but in general do not induce stem cell differentiation, which is essential for regenerating large bone defects. Here, we prepared calcium phosphate ceramics with varying physicochemical and structural characteristics. Microporosity correlated to their propensity to stimulate osteogenic differentiation of stem cells in vitro and bone induction in vivo. Implantation in a large bone defect in sheep unequivocally demonstrated that osteoinductive ceramics are equally efficient in bone repair as autologous bone grafts. Our results provide proof of concept for the clinical application of "smart" biomaterials.


Conflict of interest statement

Conflict of interest statement: H.Y., J.D.d.B., and C.A.v.B. are share-holders of Progentix Orthobiology.

Figures

Fig. 1.
Fig. 1.
Characterization of calcium phosphate ceramics. (A) XRD analysis showing the composition of the four different ceramics with their characteristic peaks indicated. (B) Environmental SEM photographs depicting their microstructure. (C and D) Protein adsorption and calcium release profile of the different ceramics, respectively. The error bars represent standard deviations. An asterisk (*) denotes statistical difference (one-way Anova and Tukey’s test, P < 0.05).
Fig. 2.
Fig. 2.
Osteogenic differentiation of hMSCs on ceramics of different composition. (A) Expression of the bone-related protein osteocalcin by hMSCs seeded in the different ceramics. Expression levels were normalized with 18S. Fold induction was calculated using the ΔCT method relative to dex-treated hMSCs in tissue culture plates. The error bars represent standard deviations. B and C indicate the bone forming potential of hMSCs seeded in different ceramics. Histological sections (B) and quantification of bone area per scaffold area (C) are shown. Basic Fuchsin stains bone red (orange arrow), methylene blue stains fibrous tissue blue (*), and the ceramic is shown in black (white arrow). The error bars represent standard deviations. An asterisk (*) denotes statistical difference (one-way Anova and Tukey’s test, P < 0.05). (Scale bar: 200 μm.)
Fig. 3.
Fig. 3.
Posterolateral spinal fusion in dogs. (A) Histological overviews showing newly formed bone in TCP and HA implants (square, region of interest). (B) The area percentage of bone for HA and TCP ceramics in the case of intramuscular implantation (gray bars) and in the spinal fusion (black bars). (C) The percentage of material available before implantation (gray bars) and upon explantation (black bars). Note that HA ceramic was not resorbed during the 12 weeks implantation in contrast with TCP. The error bars represent standard deviations. An asterisk (*) denotes statistical difference (Student’s paired t test, P < 0.05).
Fig. 4.
Fig. 4.
Osteoinductive potential of different calcium phosphate ceramics implanted intramuscularly in sheep. (A) Histological sections showing the newly formed bone (orange arrow) and the calcium phosphate ceramic (white arrow) upon 12 weeks implantation. Basic Fuchsin stains the newly formed bone red, methylene blue stains fibrous tissue blue, and the scaffold is shown in black. (B) Quantification of newly formed bone. The error bars represent standard deviations. An asterisk (*) denotes statistical difference (one-way Anova and Tukey’s test, P < 0.05). (Top, Scale bar: 10 mm.) (Bottom, Scale bar: 200 µm.)
Fig. 5.
Fig. 5.
Illium defect. Figure presents three-dimensional models of the os ilium after 12 weeks implantation. Bone formation outside the margins of the defect was found in the rhBMP-2 group, whereas in the TCP group, the material remained within the defect with new bone formation and implant resorption observed at 12 weeks.
Fig. 6.
Fig. 6.
Performance of calcium phosphate ceramics, autologous bone, and rhBMP-2 in a critical-size defect in the illium of sheep. (A) Histological sections depicting the newly formed bone within the defect created in the illium of sheep. The defect margins are indicated by the black circle (17 mm in diameter) on the left panel and on the right panel the demarked region can be seen in detail. Basic fuchsin stains bone red, methylene blue stains fibrous tissue blue, and the scaffold is shown in black. Newly formed bone is indicated by an orange arrow, autologous bone or the ceramic material are indicated by a white arrow, and fibrous tissue is indicated by an asterisk (*). B and C represent the area percentage of bone per available area between the different conditions (B) and the resorption of the ceramic after 12 weeks implantation (C). The error bars represent standard deviations. An asterisk (*) denotes statistical difference (one-way Anova and Tukey’s test, P < 0.05 (B) and Student’s paired t test, p < 0.05 (c). (Scale bar: 200 μm.)

References

    1. Chen CS, Mrksich M, Huang S, Whitesides GM, Ingber DE. Geometric control of cell life and death. Science. 1997;276(5317):1425–1428. - PubMed
    1. Engler AJ, Sen S, Sweeney HL, Discher DE. Matrix elasticity directs stem cell lineage specification. Cell. 2006;126(4):677–689. - PubMed
    1. McBeath R, Pirone DM, Nelson CM, Bhadriraju K, Chen CS. Cell shape, cytoskeletal tension, and RhoA regulate stem cell lineage commitment. Dev Cell. 2004;6(4):483–495. - PubMed
    1. Folkman J, Moscona A. Role of cell shape in growth control. Nature. 1978;273(5661):345–349. - PubMed
    1. Place ES, Evans ND, Stevens MM. Complexity in biomaterials for tissue engineering. Nat Mater. 2009;8(6):457–470. - PubMed

Publication types