. 2010 Aug 15;185(4):2273-84.
doi: 10.4049/jimmunol.1000901. Epub 2010 Jul 19.

Characterization of cytokine-induced myeloid-derived suppressor cells from normal human peripheral blood mononuclear cells

Affiliations

Characterization of cytokine-induced myeloid-derived suppressor cells from normal human peripheral blood mononuclear cells

Melissa G Lechner et al. J Immunol. .

Erratum in

  • J Immunol. 2010 Nov 1;185(9):5668

Abstract

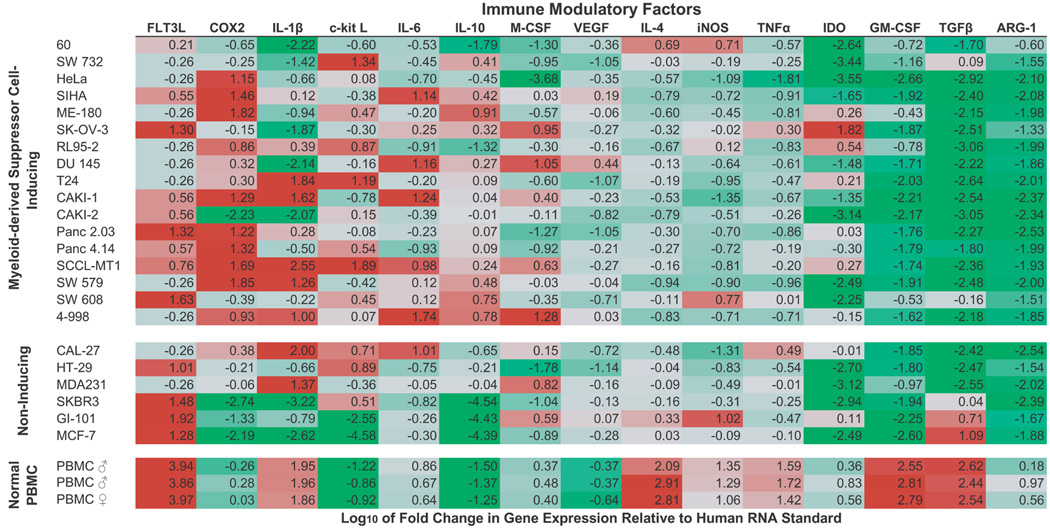
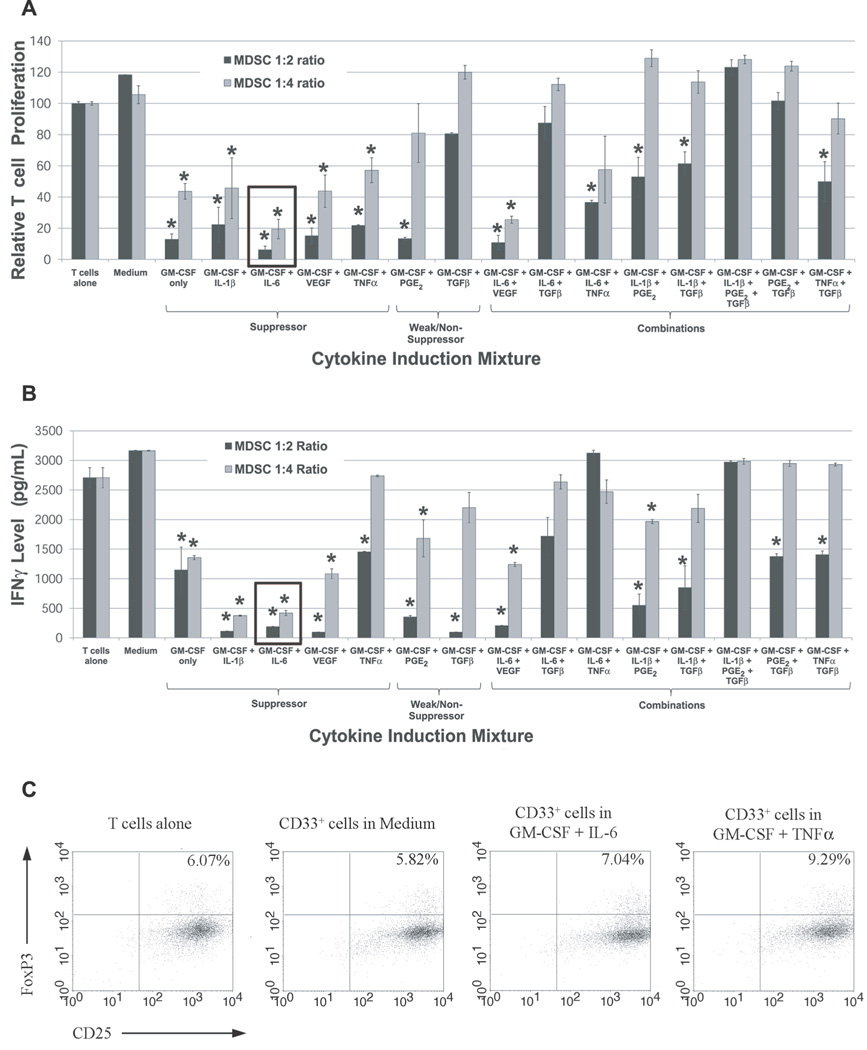
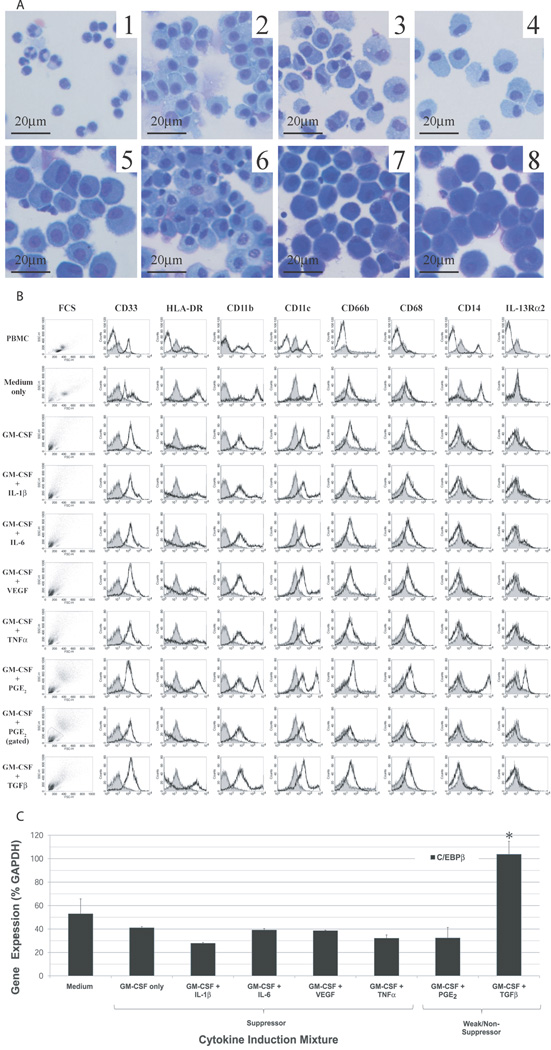
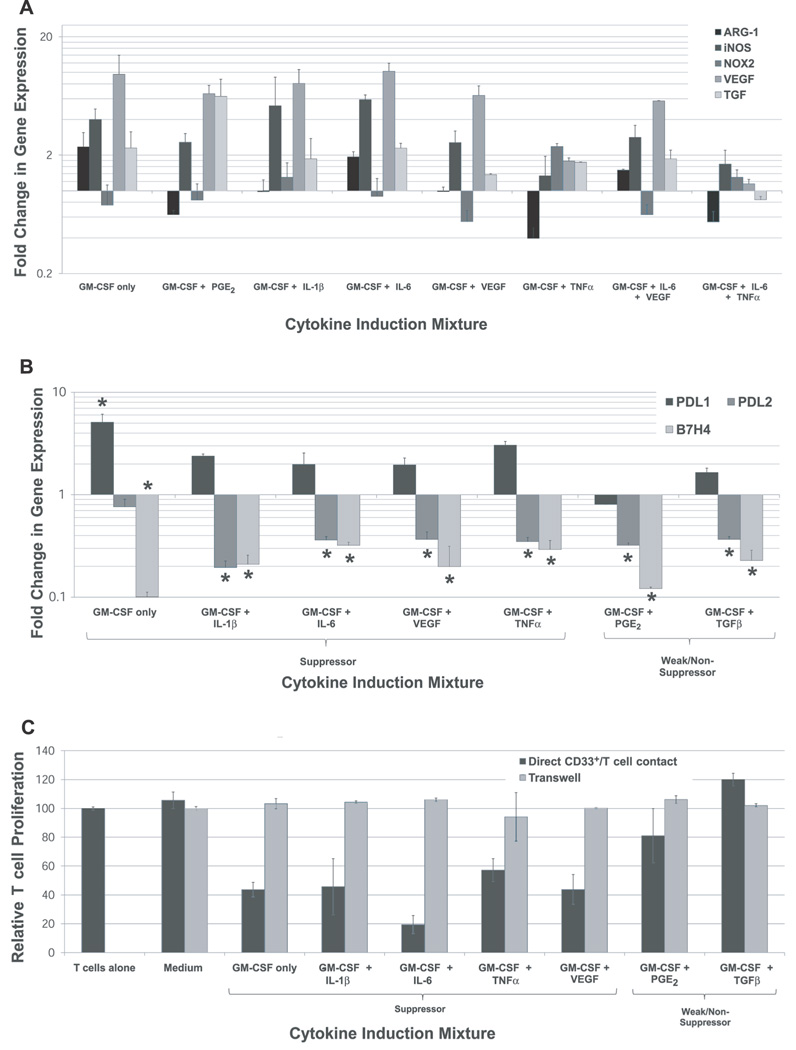
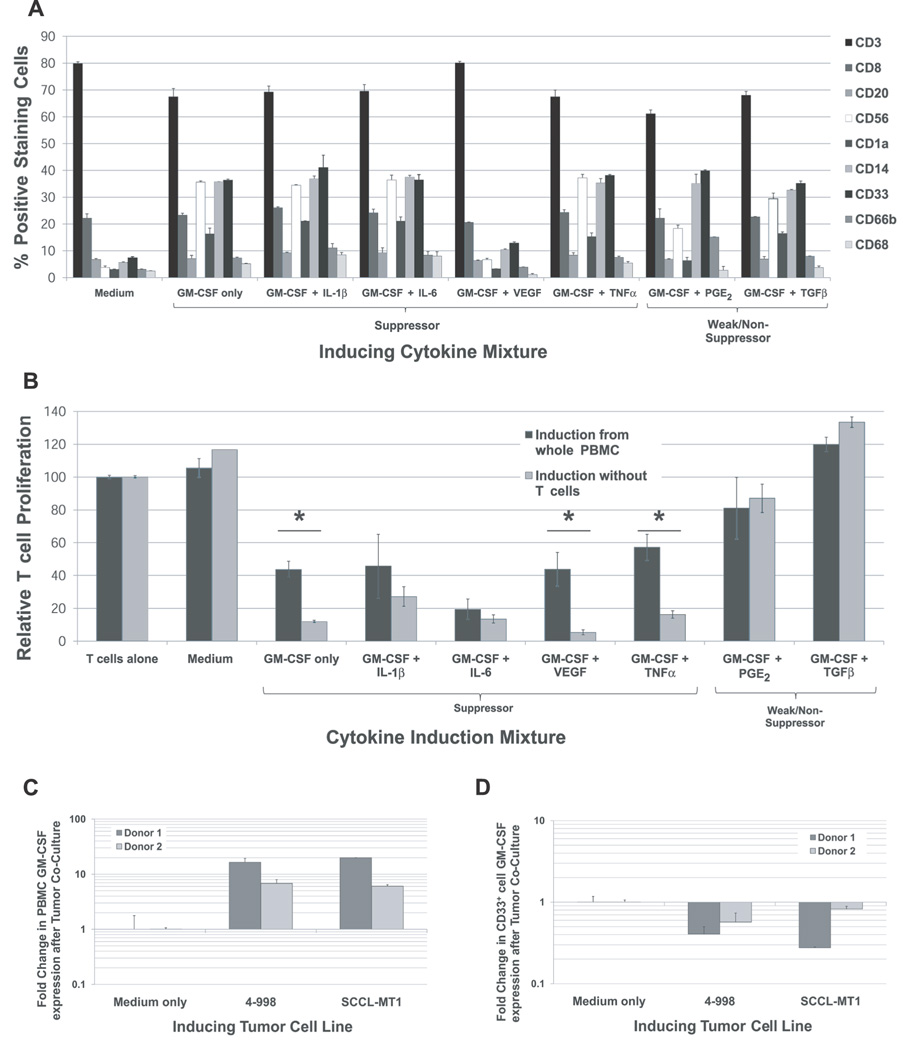
Tumor immune tolerance can derive from the recruitment of suppressor cell populations, including myeloid-derived suppressor cells (MDSCs). In cancer patients, increased MDSCs correlate with more aggressive disease and a poor prognosis. Expression of 15 immune factors (TGFbeta, IL-1beta, IL-4, IL-6, IL-10, GM-CSF, M-CSF, IDO, fms-related tyrosine kinase 3 ligand, c-kit ligand, inducible NO synthase, arginase-1, TNF-alpha, cyclo-oxygenase 2, vascular endothelial growth factor [VEGF]) by MDSC-inducing human solid tumor cell lines was evaluated by RT-PCR. Based upon these data, cytokine mixtures were then tested for their ability to generate suppressive CD33(+) cells from healthy donor PBMCs in vitro by measuring their ability to inhibit the proliferation of, and IFN-gamma production by, fresh autologous human T cells after CD3/CD28 stimulation. Induced MDSCs were characterized with respect to their morphology, surface phenotype, and gene expression profile. MDSC-inducing cancer cell lines demonstrated multiple pathways for MDSC generation, including overexpression of IL-6, IL-1beta, cyclo-oxygenase 2, M-CSF, and IDO. CD33(+) cells with potent suppressive capacity were best generated in vitro by GM-CSF and IL-6, and secondarily by GM-CSF + IL-1beta, PGE(2), TNF-alpha, or VEGF. Characterization studies of cytokine-induced suppressive cells revealed CD33(+)CD11b(+)CD66b(+)HLA-DR(low)IL-13R alpha2(int) large mononuclear cells with abundant basophilic cytoplasm. Expression of inducible NO synthase, TGFbeta, NADPH oxidase, VEGF, and/or arginase-1 was also upregulated, and Transwell studies showed suppression of autologous T cells to be contact dependent. Suppressive CD33(+) cells generated from PBMCs by GM-CSF and IL-6 were consistent with human MDSCs. This study suggests that these cytokines are potential therapeutic targets for the inhibition of MDSC induction in cancer patients.


Figures

Figure 1
Figure 1. Expression of putative MDSC-inducing factors by human solid tumor cell lines and PBMC
The fold change in gene expression of putative MDSC-inducing immune modulatory factors was determined by quantitative RT-PCR techniques for MDSC-inducing and non-inducing human solid tumor cell lines. In addition, the expression of these factors by freshly isolated PBMC from healthy volunteer donors was analyzed in parallel. Due to the large variation in gene expression levels amongst tumor cell lines, the log10 fold change is shown (e.g. fold increases of 10 and 100 are represented as a log10 changes of 2.0 and 3.0, respectively). Genes whose expression was higher in the tumor cell line than the reference sample are shown in red (90th percentile); those whose expression was lower than the reference sample are shown in green (10th percentile). Note, the differential expression of factors COX2, IL-1β, and IL-6 in MDSC-inducing and non-inducing cell lines and the high expression of GM-CSF in normal donor PBMC compared to tumor cell lines.
Figure 2
Figure 2. Cytokine-induced CD33+ MDSC demonstrate potent suppressive function
PBMC from normal donors were cultured for one week in the presence of different cytokine mixtures. CD33+ cells were then isolated and tested for their ability to suppress the (A) proliferation and (B) INFγ production by autologous T cells at ratios of 1:2 and 1:4. CD33+ cells from cultures treated with GM-CSF and IL-6, Il-1β, VEGF, PGE2, or TNFα demonstrated suppressive function. For both graphs, mean is shown with SEM. Conditions with statistically significant decreases in mean T cell proliferation compared to stimulated T cells alone are indicated by an asterisk. (C) Treg expansion by cytokine-induced MDSC in Suppression Assays: the fraction of CD25+FoxP3+ T cells (CFSE-labeled) at the conclusion of a three day Suppression Assay with cytokine-induced CD33+ cells and fresh autologous T cells was analyzed by flow cytometry. Co-cultures with CD33+ cells induced by GM-CSF + IL-6 or GM-CSF + TNFα showed increases in CD25+FoxP3+ T cells relative to stimulated T cells cultured alone or with CD33+ cells from medium-only cultures (n=1).
Figure 3
Figure 3. The morphology and phenotype of cytokine-induced CD33+ MDSC resemble tumor-induced MDSC
(A) Morphology of cytokine-induced CD33+ populations compared to PBMC by Wright-Giemsa staining (x400, original magnification). Starting PBMC population (1) shows small granulocytic and monocytic cells scattered amongst lymphocytes. CD33+ cells isolated after one week culture with complete medium alone (2) or following cytokine induction (–8) appear as large mononuclear cells with abundant cytoplasm. Non-suppressive cytokine-induced CD33+ cells (3,4) are similar in morphology to suppressive cytokine-induced CD33+ cells, though the cytoplasm of the latter frequently appear more basophilic. (B) Phenotypes of cytokine-induced CD33+ cells compared to whole PBMC and CD33+ cultured in medium alone were determined by flow cytometry. The expression of putative MDSC markers (CD33, CD11b, IL-13Rα2, CD66b) and markers of mature antigen presenting cells (HLA-DR, CD11c, CD14, CD68) was evaluated for each sample (black line) relative to isotype controls (gray). In addition, forward and side scatter analyses of cells were performed to compare size and granularity of cytokine-induced CD33+ cells to controls. For GM-CSF + PGE2 induced CD33+ cells, two discrete populations of cells were noted. For this cytokine mixture, only the granulocytic population (shown gated) expressed a phenotype consistent with human MDSC. (C) Expression of transcription factor C/EBPβ by CD33+ cells induced under different cytokine milieu was evaluated by quantitative RT-PCR techniques. There was a statistically significant difference in mean C/EBPβ gene expression only between GM-CSF + TGFβ and Medium treated CD33+ cells (p <0.05), with no difference amongst any other groups.
Figure 4
Figure 4. The expression of suppressive genes by cytokine- and tumor-induced CD33+ MDSC varies with the inducing cytokine milieu and the suppression of autologous T cells is contact dependent
(A) Gene expression of reported suppressive mechanisms in MDSC (ARG-1, iNOS, NOX2, VEGF, TGFβ) in different subsets of cytokine-induced CD33+ MDSC as determined by quantitative RT-PCR techniques. Mean fold change relative to CD33+ cells cultured in medium alone shown, +SEM. (B) Gene expression levels of PDL1 (B7H1), PDL2 (B7H2), and B7H4 were compared between suppressive and non-suppressive cytokine-induced CD33+ cells by quantitative RT-PCR studies. Mean fold change in expression relative to CD33+ from medium-only cultures shown, with SEM. Statistically significant values are indicated by an asterisk. (C) CD33+ MDSC-mediated suppression of autologous T cells is contact dependent. Suppressive cytokine-induced CD33+ cells were co-cultured with fresh T cells isolated from the same donor in a single well or separated by a transwell insert at a 1:4 ratio in a modified MDSC Suppression Assay. Mean T cell proliferation is shown, with SEM. For all transwell samples, mean T cell proliferation in the presence of cytokine-induced CD33+ cells was not statistically significantly different from stimulated T cells alone.
Figure 5
Figure 5. Cellular context for cytokine induction of CD33+ MDSC from normal donor PBMC
(A) Changes in cell types and frequencies during cytokine induction were measured by flow cytometry. Significant expansion of CD56+ (NK), CD33+ (myeloid), and CD14+ (monocyte) cell populations was observed in PBMC treated with all cytokine mixtures, with the exception of GM-CSF + VEGF. The addition of IL-1β or PGE2 appeared to increase the frequency of CD66b+ cells beyond that observed with GM-CSF treatment alone. The number and CD4/CD8 ratio of T cells did not appear to be affected by the cytokine combinations examined here, nor did the frequency of B cells (CD20+) or macrophages (CD68+). Cytokine mixtures inducing CD33+ suppressor cells did not produce changes in cell types and numbers distinct from those observed for cytokine mixtures that did not induce MDSC. (B) The suppressive function of CD33+ cells from whole PBMC or from T-cell depleted PBMC cultures treated with cytokine mixtures was compared to determine the requirement of T cells in the induction of MDSC. CD33+ MDSC generated in the absence of T cells demonstrated a comparable suppressive capacity to those generated from whole PBMC for most cytokine mixtures examined. However, for cytokine mixtures GM-CSF alone, GM-CSF + TNFα, and GM-CSF + VEGF, CD33+ generated in the absence of T cells were more suppressive than those generated from whole PBMC (p<0.05). (C and D) To shed light on possible sources of GM-CSF for the induction of suppressor cells in tumor-PBMC co-cultures, gene expression of GM-CSF in PBMC following direct co-culture with inducing tumor cell lines was measured by qRT-PCR techniques and compared to cells cultured in medium alone (mean shown, + SD). GM-CSF expression by PBMC was strongly up-regulated following tumor cell line co-culture. Analysis of GM-CSF expression in the CD33+ cell fraction suggests that the increase in GM-CSF observed is not localized to this subpopulation.

Similar articles

Cited by

References

    1. Stewart TJ, Abrams SI. How tumours escape mass destruction. Oncogene. 2008;27:5894–5903. - PubMed
    1. Gabrilovich DI, Nagaraj S. Myeloid-derived suppressor cells as regulators of the immune system. Nat Rev Immunol. 2009;9:162–174. - PMC - PubMed
    1. Serafini P, Borrello I, Bronte V. Myeloid suppressor cells in cancer: recruitment, phenotype, properties, and mechanisms of immune suppression. Semin Cancer Biol. 2006;16:53–65. - PubMed
    1. Ugel S, Delpozzo F, Desantis G, Papalini F, Simonato F, Sonda N, Zilio S, Bronte V. Therapeutic targeting of myeloid-derived suppressor cells. Curr Opin Pharmacol. 2009;9:470–481. - PubMed
    1. Rodriguez PC, Ernstoff MS, Hernandez C, Atkins M, Zabaleta J, Sierra R, Ochoa AC. Arginase I-producing myeloid-derived suppressor cells in renal cell carcinoma are a subpopulation of activated granulocytes. Cancer Res. 2009;69:1553–1560. - PMC - PubMed

Publication types

MeSH terms

Substances