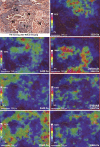
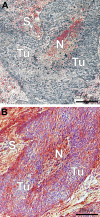
Depicting the spatial distribution of proteins in human tumor tissue combining SELDI and MALDI imaging and immunohistochemistry
- PMID: 20644210
- PMCID: PMC2942745
- DOI: 10.1369/jhc.2010.956656
Depicting the spatial distribution of proteins in human tumor tissue combining SELDI and MALDI imaging and immunohistochemistry
Abstract
Carcinoma tissue consists of not only tumor cells but also fibroblasts, endothelial cells or vascular structures, and inflammatory cells forming the supportive tumor stroma. Therefore, the spatial distribution of proteins that promote growth and proliferation in these complex functional units is of high interest. Matrix-assisted laser desorption/ionization imaging mass spectrometry is a newly developed technique that generates spatially resolved profiles of protein signals directly from thin tissue sections. Surface-enhanced laser desorption/ionization mass spectrometry (MS)combined with tissue microdissection allows analysis of defined parts of the tissue with a higher sensitivity and a broader mass range. Nevertheless, both MS-based techniques have a limited spatial resolution. IHC is a technique that allows a resolution down to the subcellular level. However, the detection and measurement of a specific protein expression level is possible only by semiquantitative methods. Moreover, prior knowledge about the identity of the proteins of interest is necessary. In this study, we combined all three techniques to gain highest spatial resolution, sensitivity, and quantitative information. We used frozen tissue from head and neck tumors and chose two exemplary proteins (HNP1-3 and S100A8) to highlight the advantages and disadvantages of each technique. It could be shown that the combination of these three techniques results in congruent but also synergetic data.
Figures


References
-
- Albrethsen J, Møller CH, Olsen J, Raskov H, Gammeltoft S (2006) Human neutrophil peptides 1, 2 and 3 are biochemical markers for metastatic colorectal cancer. Eur J Cancer 42:3057–3064 - PubMed
-
- Cazares LH, Adam BL, Ward MD, Nasim S, Schellhammer PF, Semmes OJ, Wright GJ Jr (2002) Normal, benign, preneoplastic, and malignant prostate cells have distinct protein expression profiles resolved by surface-enhanced laser desorption/ionization mass spectrometry. Clin Cancer Res 8:2541–2552 - PubMed
-
- Cazares LH, Troyer D, Mendrinos S, Lance RA, Nyalwidhe JO, Beydoun HA, Clements MA, et al. (2009) Imaging mass spectrometry of a specific fragment of mitogen-activated protein kinase/extracellular signal-regulated kinase kinase kinase 2 discriminates cancer from uninvolved prostate tissue. Clin Cancer Res 15:5541–5551 - PubMed
Publication types
MeSH terms
Substances
LinkOut - more resources
Full Text Sources
Other Literature Sources
Medical

