. 2010 Aug;7(4):046011.
doi: 10.1088/1741-2560/7/4/046011. Epub 2010 Jul 19.

Reduction of neurovascular damage resulting from microelectrode insertion into the cerebral cortex using in vivo two-photon mapping

Affiliations

Reduction of neurovascular damage resulting from microelectrode insertion into the cerebral cortex using in vivo two-photon mapping

T D Y Kozai et al. J Neural Eng. 2010 Aug.

Abstract

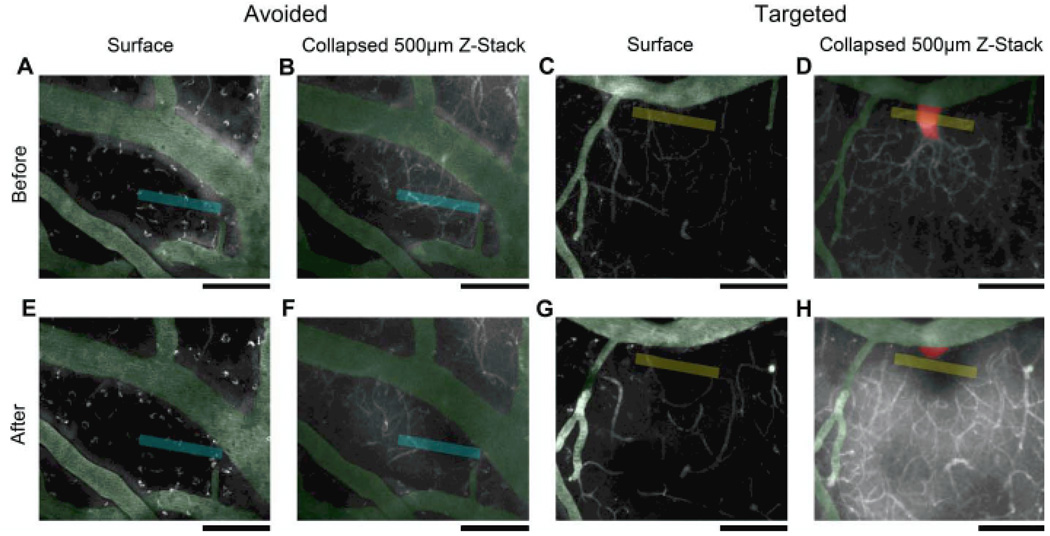
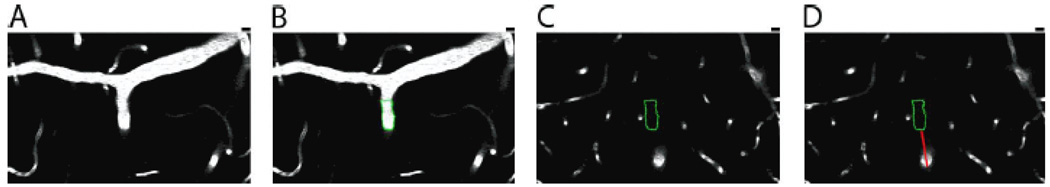
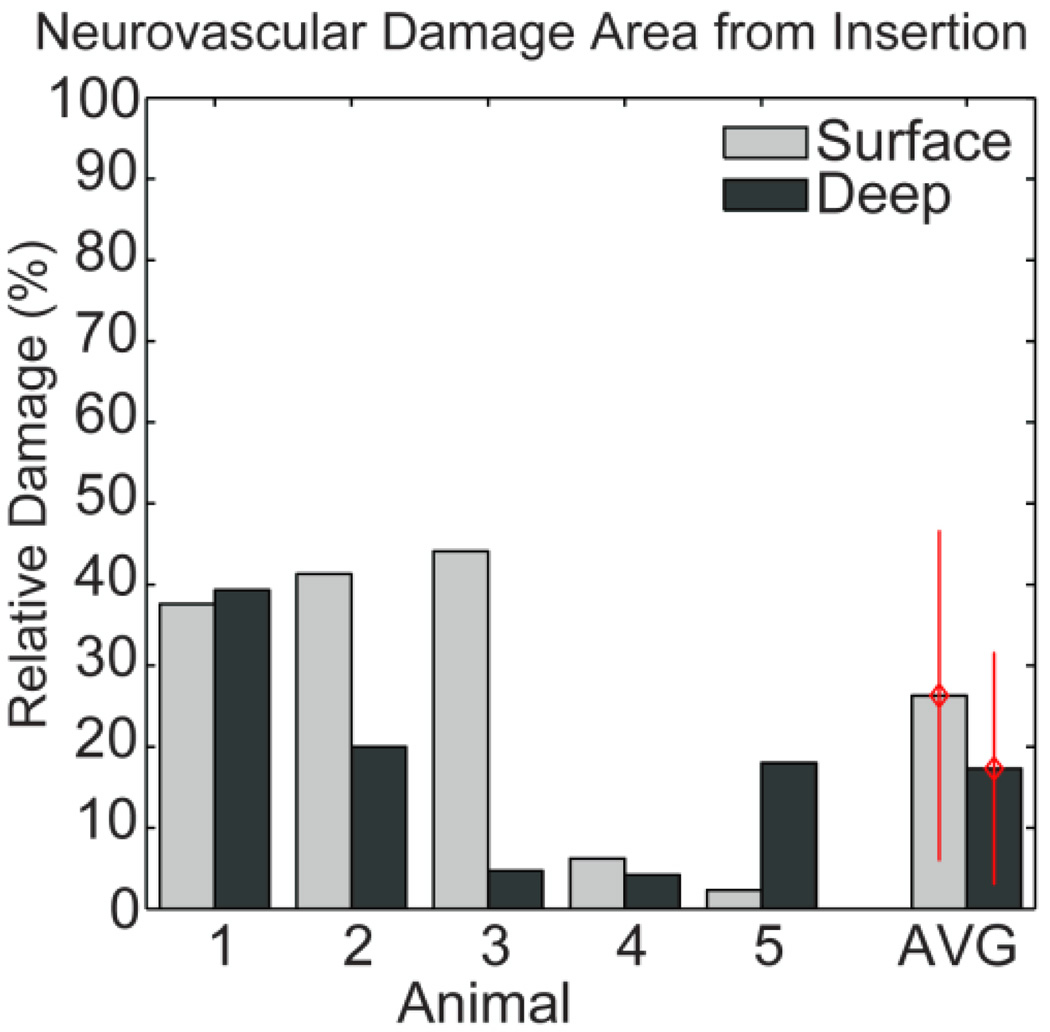
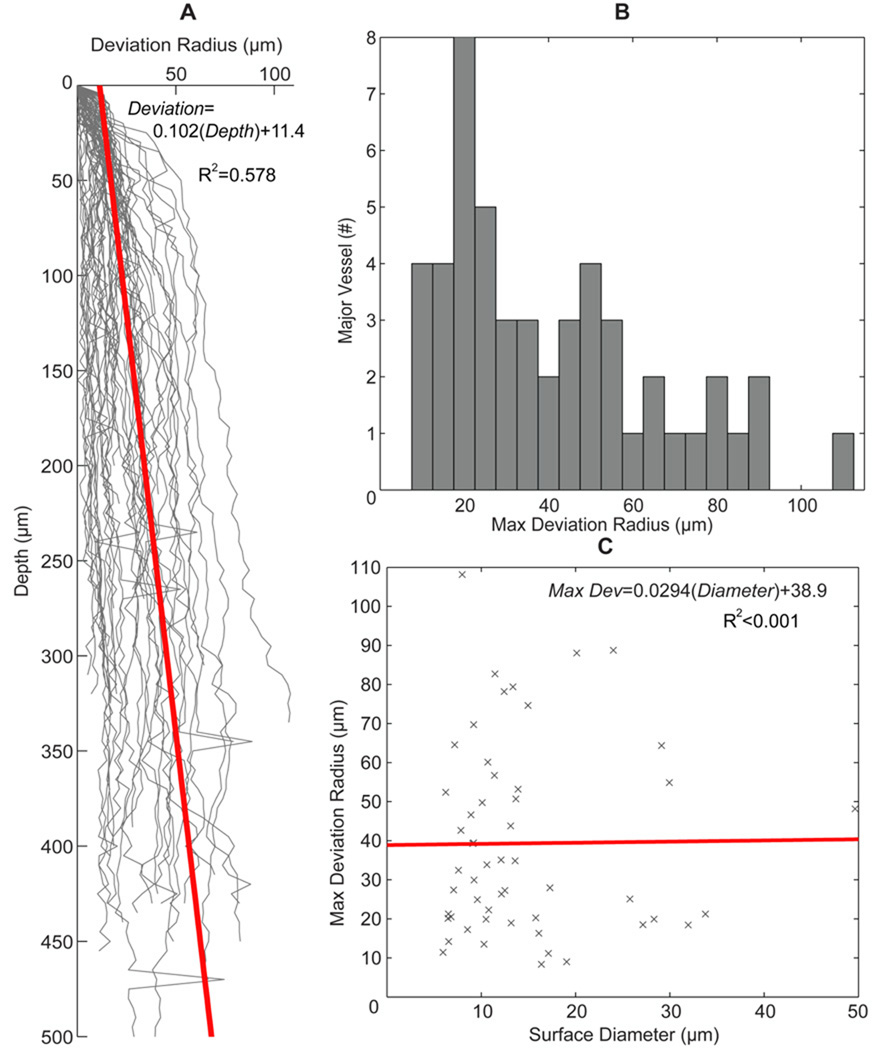
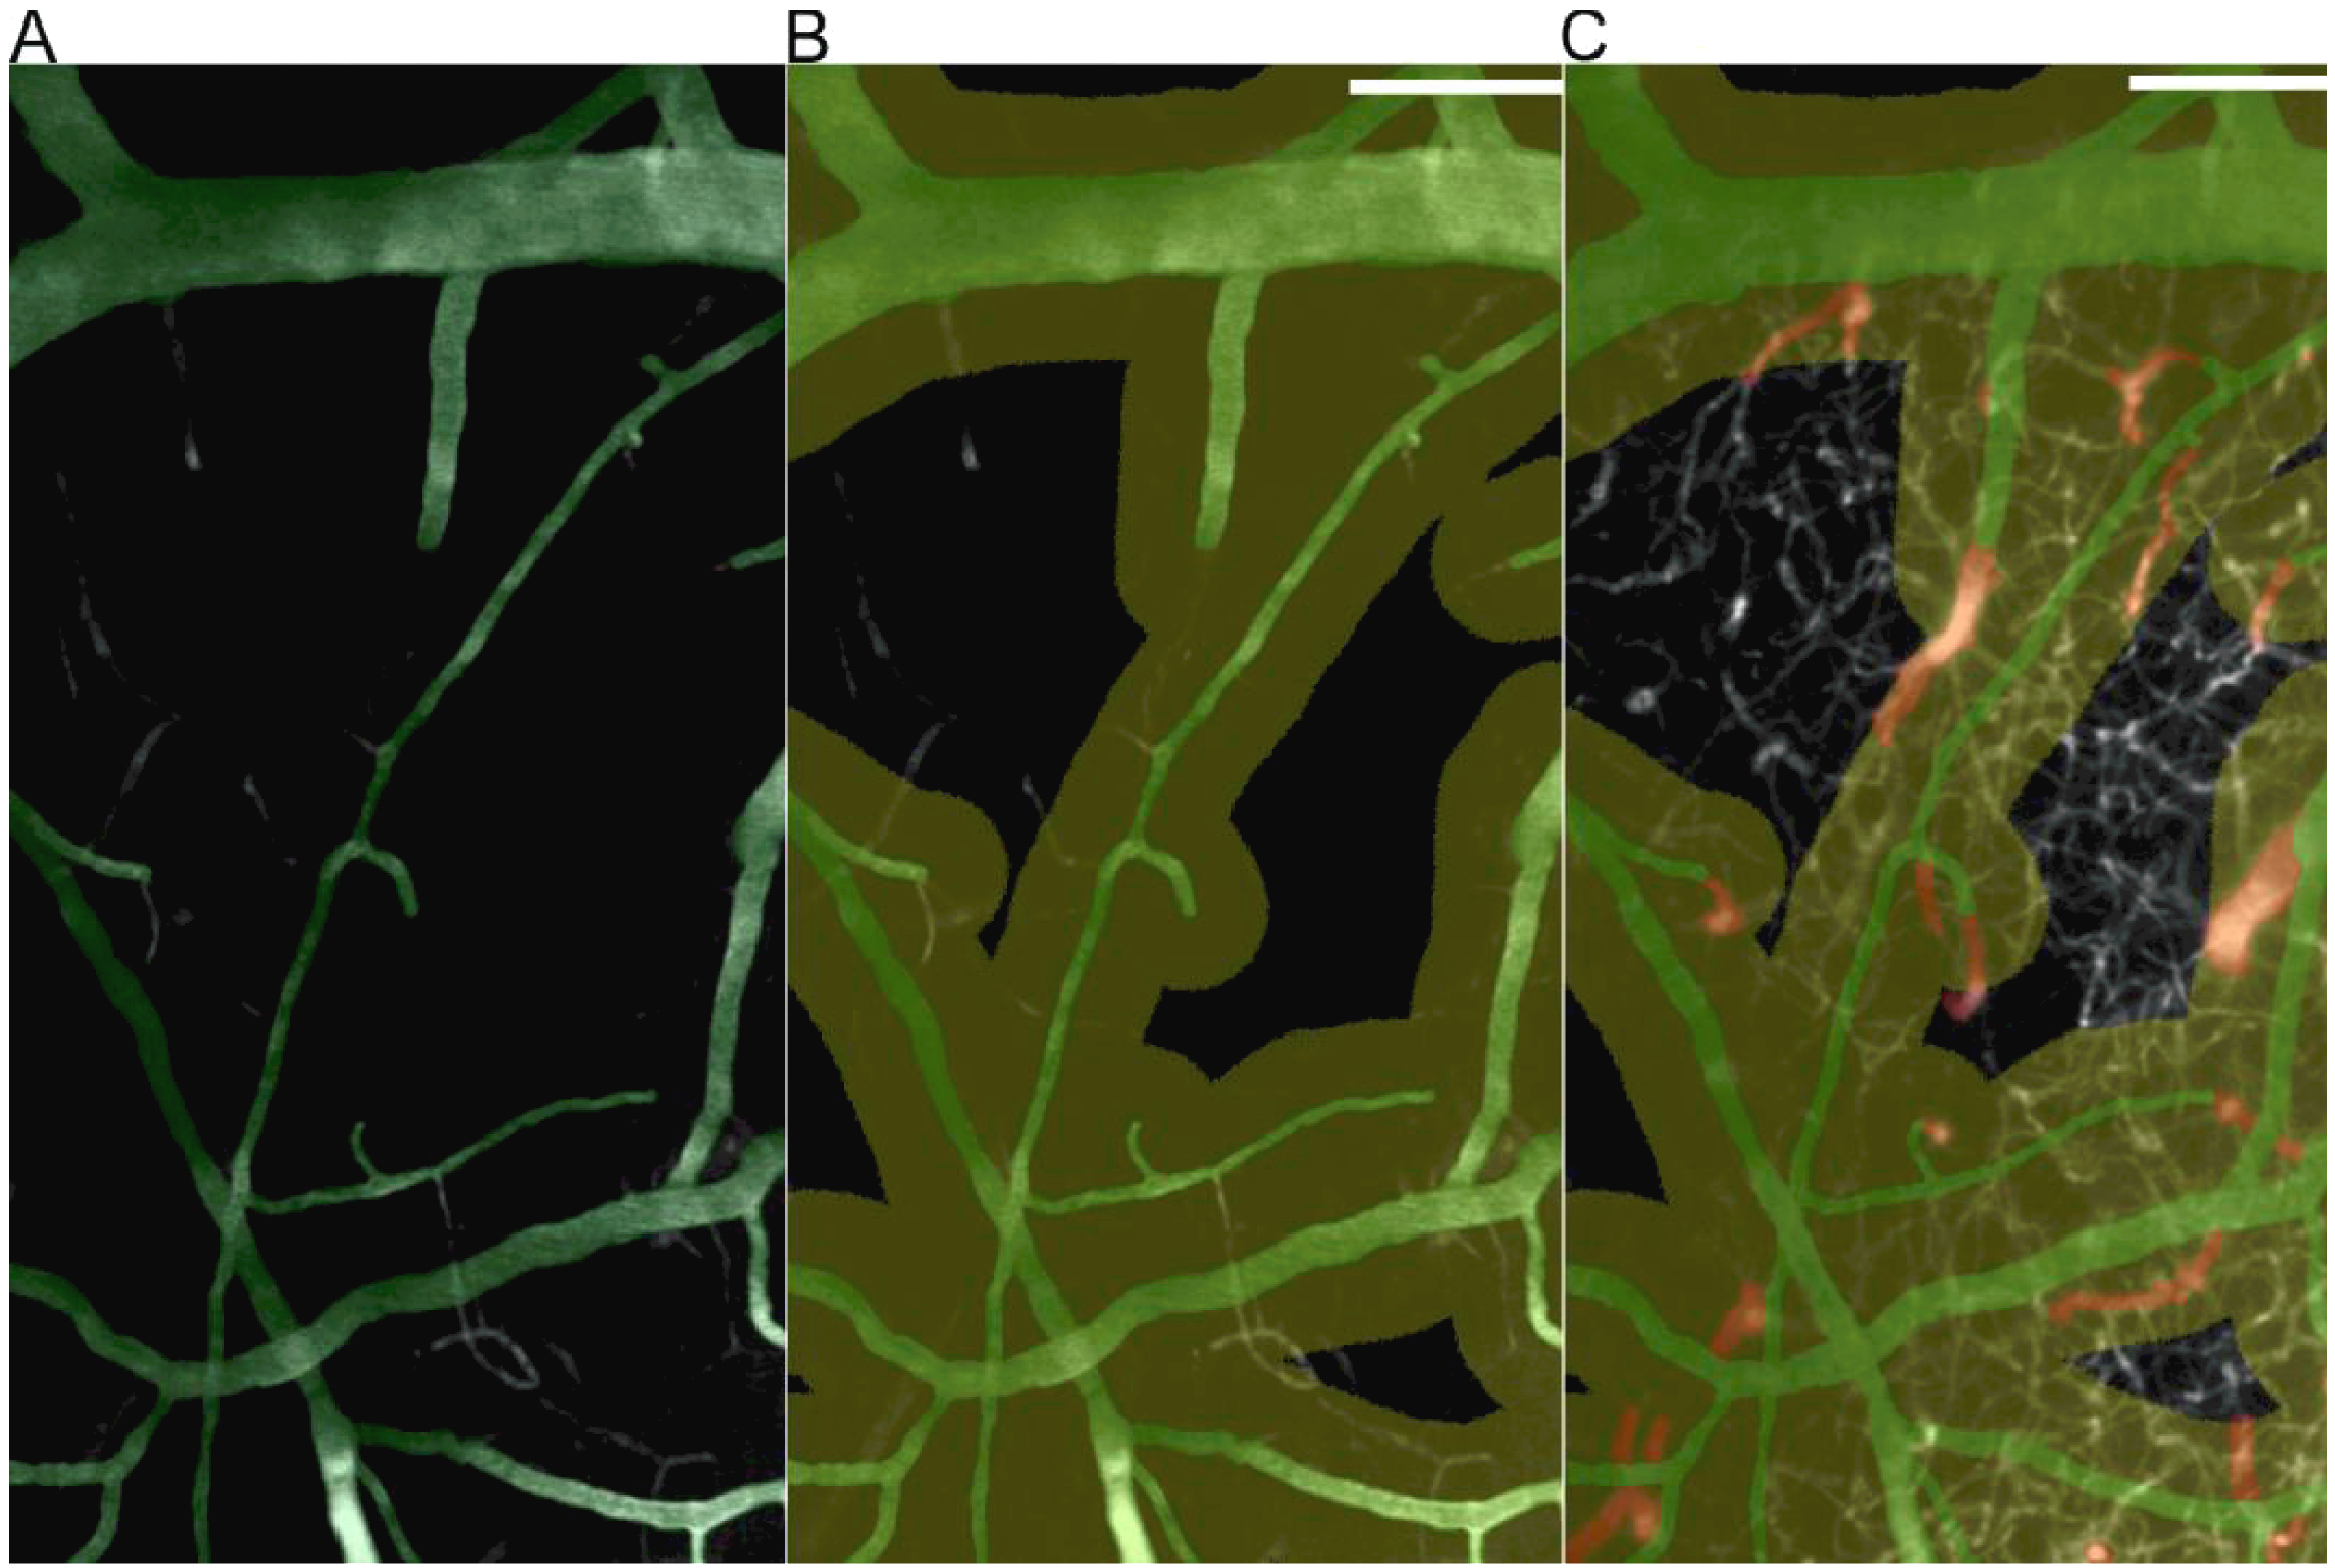
Penetrating neural probe technologies allow investigators to record electrical signals in the brain. The implantation of probes causes acute tissue damage, partially due to vasculature disruption during probe implantation. This trauma can cause abnormal electrophysiological responses and temporary increases in neurotransmitter levels, and perpetuate chronic immune responses. A significant challenge for investigators is to examine neurovascular features below the surface of the brain in vivo. The objective of this study was to investigate localized bleeding resulting from inserting microscale neural probes into the cortex using two-photon microscopy (TPM) and to explore an approach to minimize blood vessel disruption through insertion methods and probe design. 3D TPM images of cortical neurovasculature were obtained from mice and used to select preferred insertion positions for probe insertion to reduce neurovasculature damage. There was an 82.8 +/- 14.3% reduction in neurovascular damage for probes inserted in regions devoid of major (>5 microm) sub-surface vessels. Also, the deviation of surface vessels from the vector normal to the surface as a function of depth and vessel diameter was measured and characterized. 68% of the major vessels were found to deviate less than 49 microm from their surface origin up to a depth of 500 microm. Inserting probes more than 49 microm from major surface vessels can reduce the chances of severing major sub-surface neurovasculature without using TPM.


Conflict of interest statement

Conflicts

D.R. Kipke has a significant financial and leadership interest in NeuroNexus Technologies, a company specializing in neural interface devices. At the time of this study, N.B. Langhals was a consultant to NeuroNexus Technologies and T.C. Marzullo was an employee of NeuroNexus Technologies.

Figures

Figure 1
Figure 1
Two-photon imaging of cortical vasculature in a single mouse before probe insertion (A),(B),(C),(D) and after probe insertion, 30 min incubation, and probe explantation (E),(F),(G),(H). Capillaries (<5 µm diameter) are indicated as white. Major vessels (>5 µm diameter) are highlighted; surface vessels (green) and vessels below the pia (red). (A),(C),(E),(G): Image of the surface vasculature. (B),(D),(F),(H): Collapsed image of neurovasculature 0–500 µm for (A),(C),(E),(G), respectively. Blue indicates probe insertion sites for avoiding major vessels and only disrupting capillaries. Yellow indicates probe insertion sites for disrupting a major blood vessel not visible from the surface. Red blood cells can be visualized by dark regions in collapsed images. Scale bar indicates 100 µm.
Figure 2
Figure 2
Imaging of cortical vasculature in a single mouse before probe insertion (A),(B),(C),(G),(I) and after insertion (D), 30 min incubation, and probe explantation (E),(F),(H),(J). Blue indicates probe insertion sites for avoiding major vessels and only disrupting capillaries. Yellow indicates probe insertion sites for disrupting a major blood vessel not visible from the surface. (B),(C),(E),(F); Capillaries (<5 µm diameter) are indicated as white. Major vessels (>5µm diameter) are highlighted; surface vessels (green) and vessels below the pia (red). (A),(B),(D),(E): Image of the surface vasculature. (C),(F): Collapsed image of neurovasculature 0–500 µm for (B),(E), respectively. (G)–(J); 3D reconstruction of vasculature in IMARIS (Bitplane, Saint Paul, MN) to a depth into the image of 180 µm surrounding the probe. Dark regions devoid of capillaries indicate bleeding or loss of perfusion from neurovascular damage. Scale bars indicate 100 µm. Note the loss of signal when vasculature was avoided (J) is reduced compared to when major vasculature was targeted (H). White arrows indicate the targeted major vessel.
Figure 3
Figure 3
Two-photon imaging of cortical vasculature at a depth in which the targeted probe would have disrupted the major vessel in a mouse before probe insertion (A) and after probe insertion, 30 min incubation, and probe explantation (B). Neurovascular damage was visualized by dark regions, where previously blood vessels could be seen. (C), Same image as (B), but dark regions where blood cells suppress fluorescent signals have been circled by a blind observer. Scale bars indicate 100 µm.
Figure 4
Figure 4
Measuring the “deviation radius” of major neurovasculature using TPM. (A) Neurovasculature at the surface of the brain. (B). Relevant major surface vessels were traced (green), and (C), traced onto subsequent deeper image slices (250 µm). (D) Deviation radius (red) was measured as the maximum distance between the penetrating vessel wall and the nearest surface vessel wall. Scale bars indicate 10 µm.
Figure 5
Figure 5
Relative size of neurovascular damage measured using in vivo two-photon imaging from when probe insertion disrupted only capillaries normalized to when insertion targeted a major blood vessel in the same animal 30 min after insertion. Light: Hemorrhaging at the surface was reduced on average 73% (p = 0.22) when avoiding major vessels. Dark: Neurovascular damage at the vessel disruption depth, 80–255 µm below the tissue surface, was reduced on average 82.8% (p = 0.049). Red bars indicate standard deviation.
Figure 6
Figure 6
Neurovascular Characterization. (A) Traces of vessel deviation from its surface origin as a function of depth. Red trend line represents average slope. (B) Histogram plot of major blood vessels’ maximal deviation from their surface origin. (C) Surface vessel diameter is examined against maximum deviation radius from its surface origin. The correlation coefficients were calculated by ordinary least squares linear regression. Trend line shows poor correlation between surface vessel diameter and deviation.
Figure 7
Figure 7
Neurovascular characterization of non-capillary vessel diameters (>5 µm diameter). (A) Traces are colored according to their starting diameter; 5–15 µm (grey), >15 µm (black). (B) The diameter of the blood vessels is plotted after subtracting their surface diameter, showing a general decreasing trend of vessel diameter as a function of depth. The correlation coefficients were calculated by ordinary least squares linear regression.
Figure 8
Figure 8
Two photon image of the vasculature of mouse cortex. Major vessels (>5 µm diameter) are highlighted: surface vessels (green) and diving vessels (red). Capillaries (<5 µm diameter) are represented in white. (A) Surface image of mouse cortex. (B) Surface image with a 49 µm ‘No Implant’ region highlighted in yellow. Outline indicates range of 68% confidence interval for vessel deviation. (C) Collapsed image of labeled vessels to a depth of 500 µm shown with the same outline.

References

    1. Abdul-Karim MA, Al-Kofahi K, Brown EB, Jain RK, Roysam B. Automated tracing and change analysis of angiogenic vasculature from in vivo multiphoton confocal image time series. Microvasc Res. 2003;66:113–125. - PubMed
    1. Azemi E, Stauffer WR, Gostock MS, Lagenaur CF, Cui XT. Surface immobilization of neural adhesion molecule L1 for improving the biocompatibility of chronic neural probes: In vitro characterization. Acta Biomater. 2008;4:1208–1217. - PubMed
    1. Barzo P, Marmarou A, Fatouros P, Hayasaki K, Corwin F. Contribution of vasogenic and cellular edema to traumatic brain swelling measured by diffusion-weighted imaging. J Neurosurg. 1997;87:900–907. - PubMed
    1. Betz AL, Iannotti F, Hoff JT. Brain edema: a classification based on blood-brain barrier integrity. Cerebrovasc Brain Metab Rev. 1989;1:133–154. - PubMed
    1. Biran R, Martin DC, Tresco PA. Neuronal cell loss accompanies the brain tissue response to chronically implanted silicon microelectrode arrays. Experimental Neurology. 2005;195:115–126. - PubMed

Publication types

MeSH terms