Band-broadening suppressed effect in long turned geometry channel and high-sensitive analysis of DNA sample by using floating electrokinetic supercharging on a microchip
- PMID: 20644677
- PMCID: PMC2905274
- DOI: 10.1063/1.3366719
Band-broadening suppressed effect in long turned geometry channel and high-sensitive analysis of DNA sample by using floating electrokinetic supercharging on a microchip
Abstract
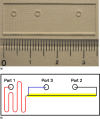
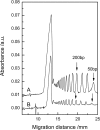
A featured microchip owning three big reservoirs and long turned geometry channel was designed to improve the detection limit of DNA fragments by using floating electrokinetic supercharging (FEKS) method. The novel design matches the FEKS preconcentration needs of a large sample volume introduction with electrokinetic injection (EKI), as well as long duration of isotachophoresis (ITP) process to enrich low concentration sample. In the curved channel [ approximately 45.6 mm long between port 1 (P1) and the intersection point of two channels], EKI and ITP were performed while the side port 3 (P3) was electrically floated. The turn-induced band broadening with or without ITP process was investigated by a computer simulation (using CFD-ACE+ software) when the analytes traveling through the U-shaped geometry. It was found that the channel curvature determined the extent of band broadening, however, which could be effectively eliminated by the way of ITP. After the ITP-stacked zones passed the intersection point from P1, they were rapidly destacked for separation and detection from ITP to zone electrophoresis by using leading ions from P3. The FEKS carried on the novel chip successfully contributed to higher sensitivities of DNA fragments in comparison with our previous results realized on either a single channel or a cross microchip. The analysis of low concentration 50 bp DNA step ladders (0.23 mugml after 1500-fold diluted) was achieved with normal UV detection at 260 nm. The obtained limit of detections (LODs) were on average 100 times better than using conventional pinched injection, down to several ngml for individual DNA fragment.
Figures


Similar articles
-
Study of a novel sample injection method (floating electrokinetic supercharging) for high-performance microchip electrophoresis of DNA fragments.Electrophoresis. 2008 May;29(9):1829-35. doi: 10.1002/elps.200700590. Electrophoresis. 2008. PMID: 18393341
-
[Preconcentration and separation of DNA fragments based on microchip electrophoresis].Se Pu. 2009 Jan;27(1):102-6. Se Pu. 2009. PMID: 19449551 Chinese.
-
Optimization of the electrokinetic supercharging preconcentration for high-sensitivity microchip gel electrophoresis on a cross-geometry microchip.Electrophoresis. 2004 Jul;25(14):2357-62. doi: 10.1002/elps.200305910. Electrophoresis. 2004. PMID: 15274018
-
High-sensitivity capillary and microchip electrophoresis using electrokinetic supercharging preconcentration. Insight into the stacking mechanism via computer modeling.J Chromatogr A. 2009 Jan 23;1216(4):660-70. doi: 10.1016/j.chroma.2008.10.077. Epub 2008 Oct 25. J Chromatogr A. 2009. PMID: 18996535 Review.
-
High-sensitivity capillary and microchip electrophoresis using electrokinetic supercharging.J Sep Sci. 2011 Oct;34(20):2790-9. doi: 10.1002/jssc.201100384. Epub 2011 Jul 27. J Sep Sci. 2011. PMID: 21793208 Review.
Cited by
-
Dynamic computer simulations of electrophoresis: 2010-2020.Electrophoresis. 2022 Jan;43(1-2):10-36. doi: 10.1002/elps.202100191. Epub 2021 Aug 2. Electrophoresis. 2022. PMID: 34287996 Free PMC article. Review.
References
LinkOut - more resources
Full Text Sources
Miscellaneous
