. 2010 Jul 13;8(7):e1000420.
doi: 10.1371/journal.pbio.1000420.

The role of spatially controlled cell proliferation in limb bud morphogenesis

Affiliations

The role of spatially controlled cell proliferation in limb bud morphogenesis

Bernd Boehm et al. PLoS Biol. .

Abstract

Although the vertebrate limb bud has been studied for decades as a model system for spatial pattern formation and cell specification, the cellular basis of its distally oriented elongation has been a relatively neglected topic by comparison. The conventional view is that a gradient of isotropic proliferation exists along the limb, with high proliferation rates at the distal tip and lower rates towards the body, and that this gradient is the driving force behind outgrowth. Here we test this hypothesis by combining quantitative empirical data sets with computer modelling to assess the potential role of spatially controlled proliferation rates in the process of directional limb bud outgrowth. In particular, we generate two new empirical data sets for the mouse hind limb--a numerical description of shape change and a quantitative 3D map of cell cycle times--and combine these with a new 3D finite element model of tissue growth. By developing a parameter optimization approach (which explores spatial patterns of tissue growth) our computer simulations reveal that the observed distribution of proliferation rates plays no significant role in controlling the distally extending limb shape, and suggests that directional cell activities are likely to be the driving force behind limb bud outgrowth. This theoretical prediction prompted us to search for evidence of directional cell orientations in the limb bud mesenchyme, and we thus discovered a striking highly branched and extended cell shape composed of dynamically extending and retracting filopodia, a distally oriented bias in Golgi position, and also a bias in the orientation of cell division. We therefore provide both theoretical and empirical evidence that limb bud elongation is achieved by directional cell activities, rather than a PD gradient of proliferation rates.


Conflict of interest statement

The authors have declared that no competing interests exist.

Figures

Figure 1
Figure 1. Gradient based morphogenesis.
(A) Schematic of the 3D organization of the vertebrate limb bud. Elongation occurs along the proximo-distal axis (away from the body), and the apical ectodermal ridge (AER) runs along the distal-most part of the bud. (B) The proliferation gradient model (or growth-based morphogenesis, Morishita and Iwasa [23]) proposes that a zone of high proliferation close to the AER drives distally directed limb elongation.
Figure 2
Figure 2. The changing 3D geometry during limb development.
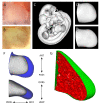
(A) The right hind limb bud at stage E11.0 from the freshly dissected embryo, and (B) a right hind limb bud from another embryo at stage E11.25, 6 h older than (A). (C) The OPT scans were converted into an iso-surface, a 3D contour of the embryo. The limb bud shapes St0, (D) and St1 (E) were virtually dissected from the whole-embryo iso-surface. (F) A comparison between the two empirically measured shapes St0 (white) and St1 (blue) which highlights the shape change over 6 h of development. The main axes are shown anterio-posterior (AP), dorso-ventral (DV), and proximo-distal (PD). (G) A virtual slice through the fully tetrahedtralised St0 mesh. The surface is discretised with a triangular mesh (green), and the internal mesenchymal volume is discretised with a 3D tetrahedral mesh (red).
Figure 3
Figure 3. A quantitative 3D map of proliferation rates.
(A) The four phases of the cell cycle: Gap 1 (G1), Synthesis (S-phase), Gap 2 (G2), and Mitosis (M phase). IddU was injected into the mouse and incorporated into the limb bud cells in S-phase (left-hand side, green bar). After time interval Ti a second injection is made, this time of BrdU, which again labels the cells in S-phase at that moment (right-hand side, red bar). At this point some of the IddU-labelled cells from the first injection (green) have left S-phase and are now in G2. These are the “Leaving cells,” or Lcells, and were counted to calculate Tc using equation (2). (B) 7 µm thick paraffin sections were imaged by confocal microscopy. For each of the 30 counting regions (white circles on sections, 215 µm diametre), the total number of cells is counted and also the number of Lcells (blue and green IddU-labelled cells, which display no red). (C) The positions of the 13 sections overlaid onto a photo of the same limb. (D) The calculated Tc values are assigned to the corresponding vertices on the 3D mesh (indicated by small coloured spheres) and are interpolated onto the remaining vertices. (E) Schematic of virtual sections anterio-posterior (AP) and dorso-ventral (DV). (F) Colors show the distribution of the Tc values in hours for the virtual sections indicated in (E). A core of low proliferation (proximal central) and areas of high proliferation (dorsal and ventral), as well as a ridge of high proliferation (anterior-distal) can be seen.
Figure 4
Figure 4. Numerical simulations based on empirical proliferation rates.
Detailed analysis of the simulation with Re = 10−2. (A) The initial limb shape St0 with the measured proliferation pattern converted into source term. High proliferating zones can be found ventrally and distally, as well as a small area dorsally. Medium levels of proliferation can be found distally and ventrally, and a core of low proliferation centrally at the proximal end. (B) The tissue displacement calculated from (A) (green arrows) is fairly uniform surface expansion, resulting in an increased size rather than a shape change. (C) The initial shape St0 (white surface) was grown in silico into the predicted shape pSt1 (green surface), which is larger but shows the same shape. (D) The predicted result pSt1 (green surface) shows significant differences with the empirical measured limb St1 (blue). (E–H) show the same as above for a simulation of a younger E10.5 limb. Despite the simpler limb bud shape (compared to E11.0) this simulation also fails to generate the correct shape change.
Figure 5
Figure 5. Exploring parameter space.
(A) The optimization process is a loop where (1) the proliferation values are interpolated onto the limb mesh, (2) the simulation predicts a new shape pSt1 according to the proliferation values, (3) the fitness function compares the predicted shape pSt1 with the real shape St1, and (4) the parameter optimization adapts the parameters according to the results of the shape comparison. This process is repeated (based on a Hooke and Jeeves direct search method [43]) until a stable proliferation pattern is obtained. (B) The proliferation pattern for positive isotropic growth shows low proliferation dorsally and ventrally, while high proliferation can be seen along the distal ridge with a trend towards the posterior side. (C) Directed tissue displacement in the PD direction is the result of the high proliferating in the distal zone. (D) Compared to the St0 limb shape (white), a clear shape change is evident for pSt1 (green). (E) Comparing the predicted limb shape pSt1 to the empirical measured St1 shows a high degree of similarity, but still overextended outgrowth, especially along the DV axis. Limb orientations are as shown in Figure 2F.
Figure 6
Figure 6. Assessing the parameter optimisations.
(A) A plot of the fitness improvements (decrease in shape difference on the y-axis) against the successive iterations of the optimisation process (x-axis). At each iteration the shape difference decreases until it converges to a stable minimum. For comparison, the green line shows the difference between St1 and pSt1 when using the BrdU/IddU data (i.e. not optimised). The red line shows the result of the optimisation with only positive proliferation (Figure 5B–E), which achieves a lower shape difference. The blue curves are the results of optimisations which allowed negative s values (tissue shrinkage). The multiple blue lines represent optimisations starting with different initial proliferation patterns, and all converge to similar results which are ∼70% lower (better) than the BrdU/IddU data (green line). Although the optimal shape difference was the minimal difference, we have illustrated the global optimum of the landscape as a high peak, following the convention of the hill-climbing analogy. Starting from different points of the fitness landscape, the parameter optimisation converges to the same “mountain peak” with the same basic pattern of growth values. In (B) and (C) the x-axis is the same as (A), but the y-axis plots the changing s values for different positions within the limb bud. Neighbouring pairs of vertices are tracked for each of four regions (distal, central, dorsal, and ventral) and illustrate that although the two cases start with different distributions of initial s values, these parameters converge to the same general layout, with high growth in distal regions, low in central regions, and tissue shrinkage in dorsal and ventral regions. (D–G) shows the results in more detail for one of the optimisation runs. The final growth pattern (D) clearly shows a discrete region of very high proliferation at the distal tip (red/yellow) and shrinking areas dorsal and ventrally (blue). The resulting tissue displacements (E) generate a new shape pSt1 (green surface in F,G) which is much flatter than before and shows a close correspondence to the real shape St1 (blue in G). Limb orientations are as shown in Figure 2F.
Figure 7
Figure 7. Limb bud mesenchymal cells display complex 3D shapes with highly dynamic filopodia.
(A) Overview of a typical in ovo electroporation result. All cell nuclei are labelled with DAPI (blue) and the GFP expression can be seen in green. (B) When many cells are labelled a general alignment of cellular processes is evident, oriented perpendicular (white double arrow) to the nearest ectoderm (bottom-right). (C) A section through the middle of a chick limb bud, showing the complex, branched and extended morphology of almost all the randomly labelling cells. (D–E) High-magnification 3D images of a few labelled cells, showing how the Golgi (red) is consistently on the same side of the nucleus (asterisks in C, blue shape in E) and revealing the extended cellular processes of the complex 3D geometry of each cell. (F) Frames from two time-lapse movies showing the dynamic extension and retraction of the filopodia (white arrowheads) over a 2 h period.
Figure 8
Figure 8. The Golgi and cell division orientations of limb bud mesenchymal cells.
(A) A map of Golgi body orientation (relative to the nucleus) on cells across the same transverse section as Figure 7C. (B) A summary of the orientation bias seen within four different regions of the mesenchymal tissue (n = 565). Dashed blue line indicates the main PD axis of elongation. (C) A map of cell division orientation; the ends of the white lines indicate the positions of daughter chromatids during telophase. (D) A summary of the bias in cell division orientation. Since each section contains a limited number of cells in telophase, these results (n = 187) were collated from all four sections seen in (C) and (E–G).
Figure 9
Figure 9. Comparing optimised versus real growth rates.
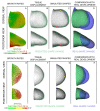
Proliferation maps on two orthogonal virtual cross-sections through the limb, from measured data and optimized simulations. (A and B) both show exactly the same empirical data (the real cell cycle times), but with two different colour maps, whereas (C) shows the fully optimised result. In (A) the map has been normalized with respect to the fastest and slowest dividing cells (a cell cycle time of 11 h (red) and 25 h (blue), respectively) and reveals a core of low proliferation in the central proximal region and areas of high proliferation in ventral and anterior regions. In (B), which shows exactly the same empirical data as (A), the colour map has been normalized with respect to the fully optimsed result shown in (C) and in Figure 6D. (C) To achieve growth-based morphogenesis the proliferation rates must adopt extreme values—with s ranging from −0.1 h−1 to 0.6 h−1. When the real cell cycle times are displayed with the same colour map (B) they constitute a very narrow range between these extremes—hardly any variation is seen. This is also highlighted by mapping the colour map for (A) under the colour map for (B) and (C), where again it can be seen that the range of empirical values is a small fraction of the extreme values required for growth-based morphogenesis.

References

    1. Wolpert L. The French Flag problem: a contribution to the discussion on pattern development and regulation; In: Waddington C. H, editor. Edinburgh: Edinburgh University Press; 1968.
    1. Wolpert L. Positional information and the spatial pattern of cellular differentiation. J Theor Biol. 1969;25:1–47. - PubMed
    1. Gasseling M. T, Saunders J. W., Jr Effects of the apical ectodermal ridge on growth of the versene-stripped chick limb bud. Dev Biol. 1961;3:1–25. - PubMed
    1. Bell E, Saunders J. W, Jr, Zwilling E. Limb development in the absence of ectodermal ridge. Nature. 1959;184(Suppl 22):1736–1737. - PubMed
    1. Saunders J. W., Jr Is the progress zone model a victim of progress? Cell. 2002;110:541–543. - PubMed

Publication types