. 2010 Jul 13;8(7):e1000419.
doi: 10.1371/journal.pbio.1000419.

Active RNA polymerases: mobile or immobile molecular machines?

Affiliations

Active RNA polymerases: mobile or immobile molecular machines?

Argyris Papantonis et al. PLoS Biol. .

Abstract

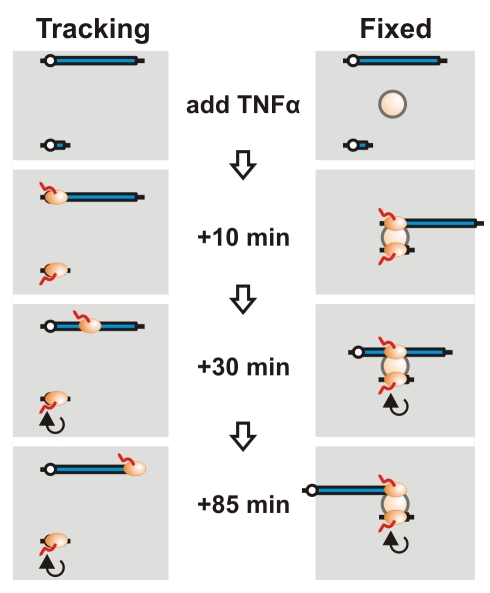
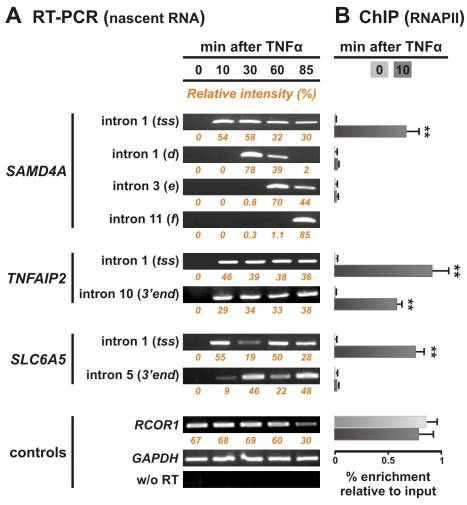
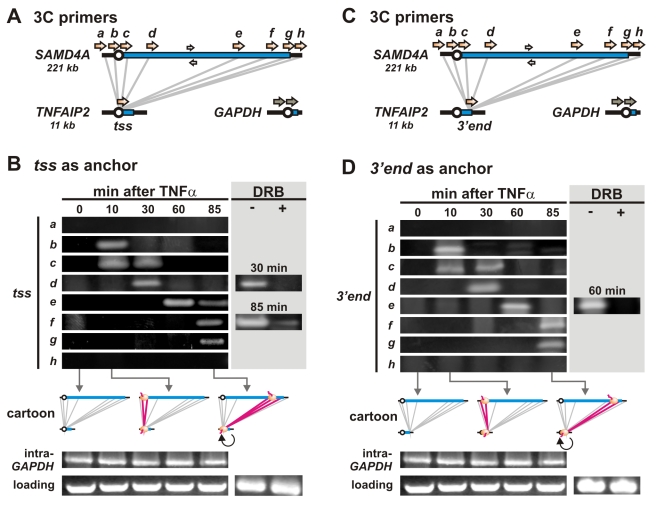
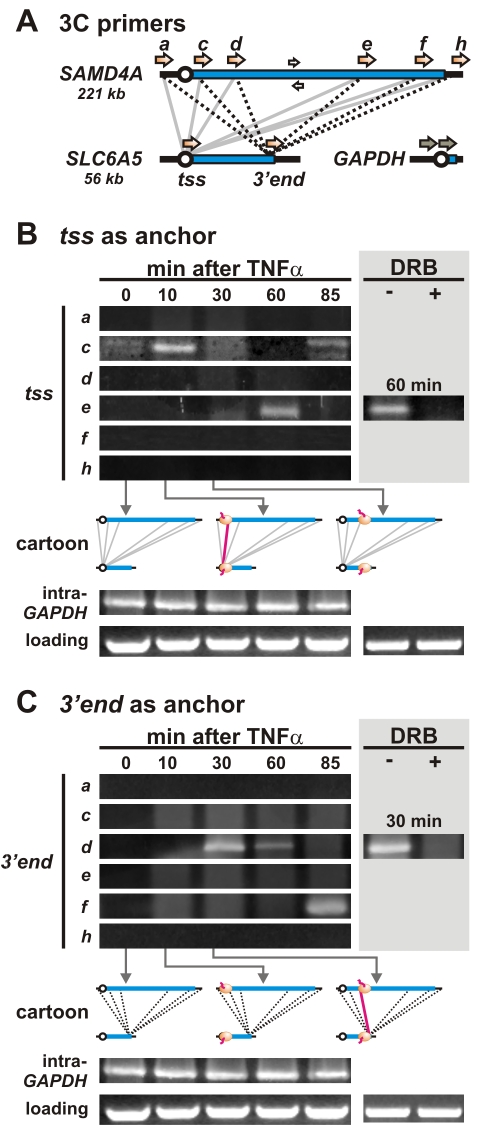
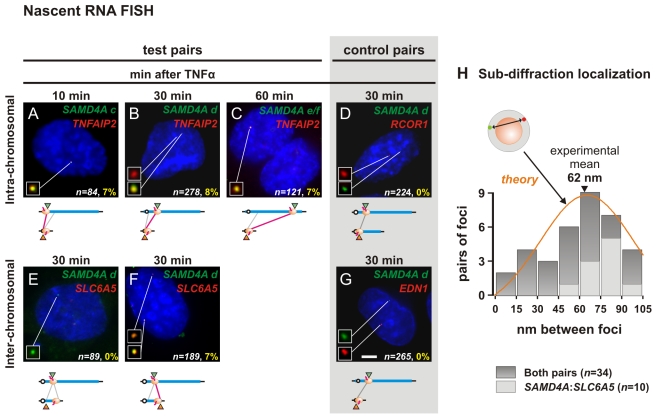
It is widely assumed that active RNA polymerases track along their templates to produce a transcript. We test this using chromosome conformation capture and human genes switched on rapidly and synchronously by tumour necrosis factor alpha (TNFalpha); one is 221 kbp SAMD4A, which a polymerase takes more than 1 h to transcribe. Ten minutes after stimulation, the SAMD4A promoter comes together with other TNFalpha-responsive promoters. Subsequently, these contacts are lost as new downstream ones appear; contacts are invariably between sequences being transcribed. Super-resolution microscopy confirms that nascent transcripts (detected by RNA fluorescence in situ hybridization) co-localize at relevant times. Results are consistent with an alternative view of transcription: polymerases fixed in factories reel in their respective templates, so different parts of the templates transiently lie together.


Conflict of interest statement

The authors have declared that no competing interests exist.

Figures

Figure 1
Figure 1. Distinguishing between tracking and fixed RNA polymerases.
Before adding TNFα, both the long and short gene are not transcribed. Assuming they lie far apart on the same chromosome, they are unlikely to yield detectable 3C products. Ten min after adding TNFα, RNA polymerases (ovals) initiate on both genes. If active polymerases track, it remains unlikely that any part of the two genes will contact each other. However, if the two genes diffuse to one factory (sphere) and are then transcribed by transiently immobilized polymerases, the two promoters will lie close together. After 30 min, the pioneering polymerase on the short gene has terminated and been replaced by others that continuously transcribe it, while the pioneering polymerase on the long gene has only transcribed one-third of the gene. If polymerases track, the two genes are still unlikely to be together. But if polymerases are immobilized in a factory, the parts of the two genes currently being transcribed will lie together and yield a 3C product. After 85 min, the pioneering polymerase reaches the terminus of the long gene. If polymerases track, the two genes will still be apart; if immobilized, the terminus should now contact the short gene.
Figure 2
Figure 2. Polymerases initiate rapidly and synchronously on responding genes and elongate at expected rates.
(A) Nascent RNA detected using reverse transcriptase PCR (RT-PCR). Total RNA was isolated from HUVECs 0–85 min after adding TNFα, treated with DNase, and intronic RNA detected. No nascent RNA copied from SAMD4A, TNFAIP2, or SLC6A5 is detected at 0 min. For 221 kbp SAMD4A, nascent RNA appears at the tss after 10 min. As polymerases continue to initiate thereafter (albeit at declining rates), signal is seen at the tss between 15 and 85 min; however, many of these polymerases abort within ∼10 kbp of the tss (Figure S1; [9]). Nascent RNA from region d of intron 1 (34 kbp into the gene) is seen only after 30 min. Pioneering polymerases reach this region after 30 min and the slowest by 60 min; after 85 min all have passed by. Similarly, pioneering polymerases only reach introns 3 and 11 after 60 and 85 min, respectively. TNFAIP2 is 11 kbp, and polymerases in the population can generate intronic RNA from both 5′ and 3′ ends within 10 min (it is then transcribed throughout the 85 min). SLC6A5—a 56 kbp gene—yields an intermediate pattern. No signal is again seen at 0 min, and pioneering polymerases generate maximal levels of intronic RNA at the tss after 10 min, and the 3′ end after 30 min; then, the cycle repeats between 60 and 85 min. Controls show levels of intronic RNA from two non-responsive, active genes (GAPDH and RCOR1), and that amplimers do not result from contaminating genomic DNA (using GAPDH probes, but replacing RT by Taq polymerase). Numbers under each panel (orange) correspond to the relative intensity of bands, corrected for background, and normalized to GAPDH levels. (B) Bound RNA polymerase II detected by chromatin immunoprecipitation (ChIP). Enrichments relative to input DNA (normalised to GAPDH levels) are shown 0 and 10 min after stimulation (light and dark grey bars, respectively). Almost no polymerase is bound to any part of SAMD4A, TNFAIP2, or SLC6A5 at 0 min. The tss of SAMD4A is occupied by polymerases within 10 min of induction; however, levels further 3′ remain low as pioneering polymerases have not yet reached these regions. For TNFAIP2, some polymerases bind after 10 min, while others have reached the 3′ end as the gene is so short. For SLC6A5, polymerases bind by 10 min to the tss but have not yet reached the 3′ end. RCOR1 was analyzed as it was used as a control in RNA FISH experiments. Error bars show standard deviations from two independent experiments. **p<0.01, Student's t test compared to 0 min.
Figure 3
Figure 3. Contacts between two TNFα-responsive genes 50 Mbp apart on the same chromosome follow engaged polymerases.
(A) Positions of 3C primers on SAMD4A and the tss of TNFAIP2 (orange arrows) and GAPDH (grey arrows). Grey lines: 3C interactions monitored. White arrows: primers used for loading controls. (B) 3C. HUVECs were treated with TNFα for 0–85 min, 3C templates prepared using SacI, and PCR conducted using equal weights of DNA and the primer pairs indicated; after gel electrophoresis and SYBR green staining, images of resulting gels are shown. The presence of a band reflects a high contact frequency between respective primer targets. Cartoons illustrate where polymerases are bound at different times and the interactions analyzed (grey lines); red lines indicate interactions yielding bands, and these always correlate with the presence of a polymerase on both contacting partners. In selected cases, DRB was added 20 min prior to harvesting cells (grey box); this reduces band intensity, indicating that contacts depend on transcription. GAPDH primers yield uniform levels of amplimers, as do loading controls. (C) Positions of 3C primers on SAMD4A and the 3′ end of TNFAIP2. (D) Changing contacts between SAMD4A and the 3′ end of TNFAIP2. The pattern is essentially the same as that in panel (B). Panels (B) and (D) share the same pair of loading and intra-GAPDH controls (excluding ± DRB), so the same image is shown in both panels.
Figure 4
Figure 4. Contacts between two TNFα-responding genes on different chromosomes (14 and 11) follow engaged polymerases.
(A) Positions of 3C primers and the interactions screened (grey and dotted black lines). (B) Contacts between the tss of SLC6A5 (the anchor) and different parts of SAMD4A. Contacts/bands are only detected when polymerases are on both contacting partners. (C) Contacts between the 3′ end of SLC6A5 (the anchor) and different parts of SAMD4A. As in (B), two strong bands are seen, but they are in different positions. We suggest this is because it takes a polymerase 20–30 min to reach the 3′ end of SLC6A5 now used as an anchor; then, contacts/bands are again only detected when polymerases are on both contacting partners. Panels (B) and (C) share the same pair of loading and intra-GAPDH controls (excluding ± DRB), so the same image is shown in both panels.
Figure 5
Figure 5. Colocalization of intronic RNA demonstrated by RNA FISH.
HUVECs were treated with TNFα for 10, 30, or 60 min, and nascent RNAs copied from test and control pairs of genes detected by RNA FISH. (A–C) Colocalization of nascent RNAs encoded by genes on the same chromosome. The two probes target RNA copied from intron 2 of TNFAIP2 (red) and intronic region c, or d, or e/f of SAMD4A (green); representative images of DAPI-stained nuclei are shown (insets provide magnifications of foci indicated). Red and green foci mark (non-colocalizing) nascent transcripts copied from one (or both) allele, and yellow foci colocalizing ones; n gives the number of alleles active in all cells analyzed that have ≥1 green focus plus ≥1 red focus. Numbers in yellow give the fraction of colocalizing red and green foci (where >75% pixels in one focus share red and green signal) expressed as a percentage of n; values were significantly different from those seen in (D) with a control gene (p<10−3, Fischer's exact test, one-tailed). The cartoon illustrates the targets of red and green probes (triangles), and the positions of polymerases; red lines between targets indicate that yellow foci were detected (grey lines: no yellow foci detected—see Figure S5C). (D) Yellow foci were never seen with probes targeting intronic RNA copied from SAMD4A and a (non-responsive) control gene (RCOR1) that lies between SAMD4A and TNFAIP2. (E–F) Colocalization of nascent RNAs encoded by genes on different chromosomes. The two probes target RNA copied from intronic region d of SAMD4A (green) and either intron 1 or 10 of SLC6A5 (red); only the latter yields yellow foci (the number of yellow foci was significantly different from that seen in (G) with a control gene; p<10−3, Fischer's exact test, one-tailed). (G) Yellow foci were never seen with probes targeting intronic RNA copied from SAMD4A and a (non-responsive) control gene (EDN1) that lies on a different chromosome from SAMD4A. Bar: 5 µm. (H) Sub-diffraction localization of peaks of red and green signal within yellow foci. Gaussian curves were fitted to the intensities of the red and green signals, and distances between peaks determined with a precision of 15 nm (see Methods for details). Dark grey bars illustrate distances obtained from 34 yellow foci seen in images like those in (B) and (F); the mean distance is 62 nm. Light grey bars illustrate similar distances obtained from 10 yellow foci like that in (F). The model shows a red and green point randomly distributed in a 35 nm shell (grey) around an 87 nm diameter factory (orange sphere); simulations using this model yield the distribution indicated (orange line).

Similar articles

Cited by

References

    1. Alberts B, Johnson A, Lewis J, Raff M, Roberts K, Walter P. Molecular biology of the cell 4th edition. New York: Garland Science; 2002. 1463
    1. Jackson D. A, McCready S. J, Cook P. R. RNA is synthesised at the nuclear cage. Nature. 1981;292:552–555. - PubMed
    1. Cook P. R. The organization of replication and transcription. Science. 1999;284:1790–1795. - PubMed
    1. Sexton T, Umlauf D, Kurukuti S, Fraser P. The role of transcription factories in large-scale structure and dynamics of interphase chromatin. Semin Cell Dev Biol. 2007;18:691–697. - PubMed
    1. Cook P. R. A model for all genomes; the role of transcription factories. J Mol Biol. 2009;395:1–10. - PubMed

Publication types

MeSH terms