

Microtable arrays for culture and isolation of cell colonies
- PMID: 20644916
- PMCID: PMC2996274
- DOI: 10.1007/s00216-010-3984-1
Microtable arrays for culture and isolation of cell colonies
Abstract
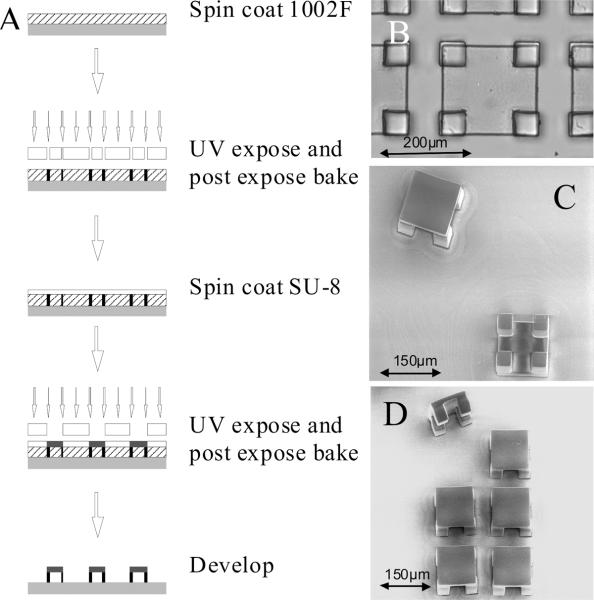
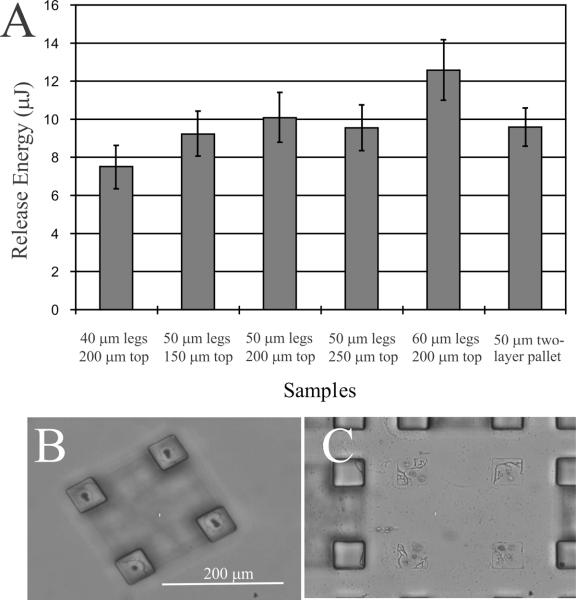
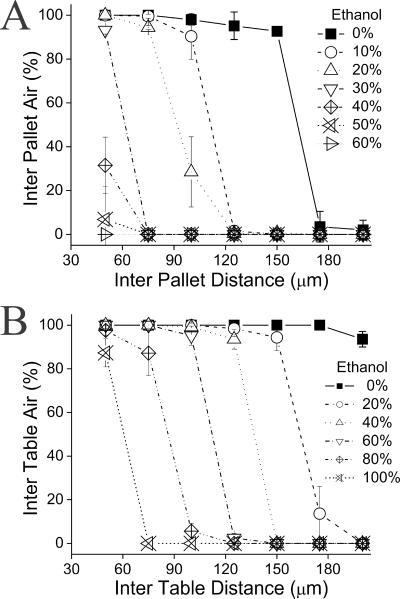
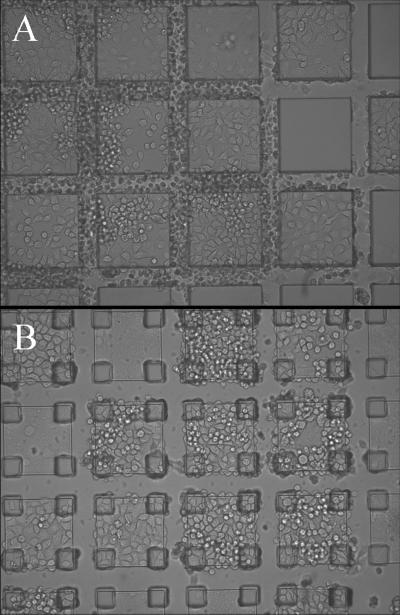
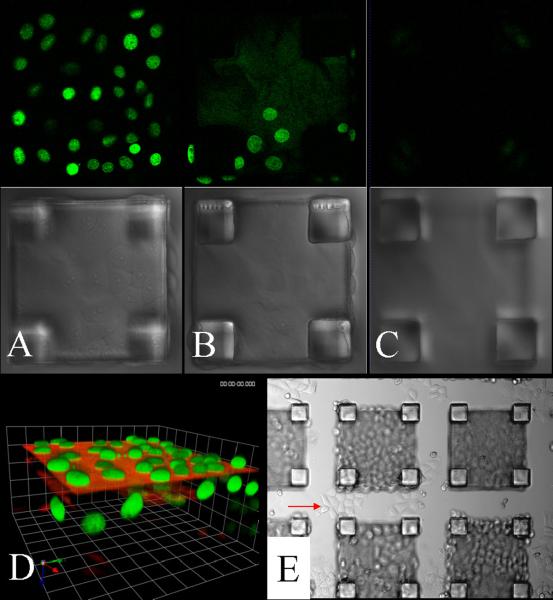
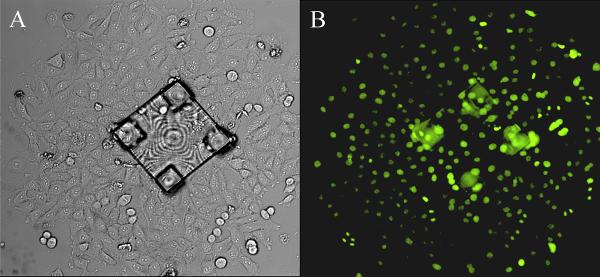
Cell microarrays with culture sites composed of individually removable microstructures or micropallets have proven benefits for isolation of cells from a mixed population. The laser energy required to selectively remove these micropallets with attached cells from the array depends on the microstructure surface area in contact with the substrate. Laser energies sufficient to release micropallets greater than 100 μm resulted in loss of cell viability. A new three-dimensional culture site similar in appearance to a table was designed and fabricated using a simple process that relied on a differential sensitivity of two photoresists to UV-mediated photopolymerization. With this design, the larger culture area rests on four small supports to minimize the surface area in contact with the substrate. Microtables up to 250 × 250 μm were consistently released with single 10-μJ pulses to each of the four support structures. In contrast, microstructures with a 150 × 150-μm surface area in contact with the substrate could not be reliably released at pulse energies up to 212 μJ. Cassie-Baxter wetting is required to provide a barrier of air to localize and sequester cells to the culture sites. A second asset of the design was an increased retention of this air barrier under conditions of decreased surface tension and after prolonged culture of cells. The improved air retention was due to the hydrophobic cavity created beneath the table and above the substrate which entrapped air when an aqueous solution was added to the array. The microtables proved an efficient method for isolating colonies from the array with 100% of selected colonies competent to expand following release from the array.
Figures
Similar articles
-
Stability of virtual air walls on micropallet arrays.Anal Chem. 2007 Sep 15;79(18):7104-9. doi: 10.1021/ac070911s. Epub 2007 Aug 18. Anal Chem. 2007. PMID: 17705452
-
Isolation and in vitro culture of rare cancer stem cells from patient-derived xenografts of pancreatic ductal adenocarcinoma.Anal Chem. 2013 Aug 6;85(15):7271-8. doi: 10.1021/ac401165s. Epub 2013 Jul 15. Anal Chem. 2013. PMID: 23815678 Free PMC article.
-
Sorting and expansion of murine embryonic stem cell colonies using micropallet arrays.Cytometry A. 2009 Feb;75(2):121-9. doi: 10.1002/cyto.a.20672. Cytometry A. 2009. PMID: 19012319 Free PMC article.
-
Single cell analytics: an overview.Adv Biochem Eng Biotechnol. 2011;124:99-122. doi: 10.1007/10_2010_96. Adv Biochem Eng Biotechnol. 2011. PMID: 21072695 Review.
-
Bio-cell chip fabrication and applications.Methods Mol Biol. 2009;509:145-58. doi: 10.1007/978-1-59745-372-1_10. Methods Mol Biol. 2009. PMID: 19212720 Review.
Cited by
-
A Bench-Top Approach for Isolation of Single Antibody Producing Chinese Hamster Ovary (CHO) Cells Using a Microwell-Based Microfluidic Device.Micromachines (Basel). 2022 Nov 10;13(11):1939. doi: 10.3390/mi13111939. Micromachines (Basel). 2022. PMID: 36363960 Free PMC article.
-
Large area magnetic micropallet arrays for cell colony sorting.Lab Chip. 2016 Jan 7;16(1):172-81. doi: 10.1039/c5lc01131k. Lab Chip. 2016. PMID: 26606460 Free PMC article.
-
A Microfluidic Single-Cell Cloning (SCC) Device for the Generation of Monoclonal Cells.Cells. 2020 Jun 18;9(6):1482. doi: 10.3390/cells9061482. Cells. 2020. PMID: 32570745 Free PMC article.
-
Directed molecular evolution to design advanced red fluorescent proteins.Nat Methods. 2011 Nov 29;8(12):1019-26. doi: 10.1038/nmeth.1776. Nat Methods. 2011. PMID: 22127219 Free PMC article.
-
Highly efficient cellular cloning using Ferro-core Micropallet Arrays.Sci Rep. 2017 Oct 12;7(1):13081. doi: 10.1038/s41598-017-13242-1. Sci Rep. 2017. PMID: 29026113 Free PMC article.
References
-
- Patel D. Separating Cells. Springer-Verlag; New York: 2001.
-
- Burridge K, Chrzanowska-Wodnicka M. Ann. Rev Cell Dev Biol. 1996;12:463–519. - PubMed
-
- Chiquet M, Matthisson M, Koch M, Tannheimer M, Chiquet-Ehrismann R. Biochem Cell Biol. 1996;74:737–744. - PubMed
-
- Ingber DE. Ann Rev Physiol. 1997;59:575–599. - PubMed
Publication types
MeSH terms
Substances
Grants and funding
LinkOut - more resources
Full Text Sources
Other Literature Sources
