. 2010 Jul 20:9:194.
doi: 10.1186/1476-4598-9-194.

TWIST1 promotes invasion through mesenchymal change in human glioblastoma

Affiliations

TWIST1 promotes invasion through mesenchymal change in human glioblastoma

Svetlana A Mikheeva et al. Mol Cancer. .

Abstract

Background: Tumor cell invasion into adjacent normal brain is a mesenchymal feature of GBM and a major factor contributing to their dismal outcomes. Therefore, better understandings of mechanisms that promote mesenchymal change in GBM are of great clinical importance to address invasion. We previously showed that the bHLH transcription factor TWIST1 which orchestrates carcinoma metastasis through an epithelial mesenchymal transition (EMT) is upregulated in GBM and promotes invasion of the SF767 GBM cell line in vitro.

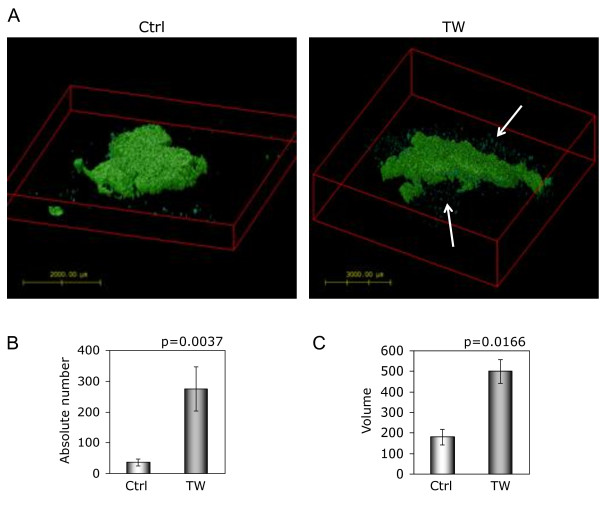
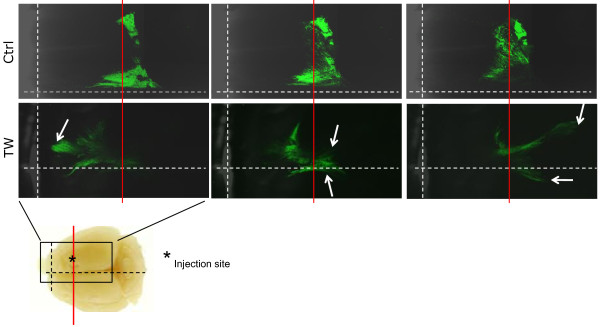
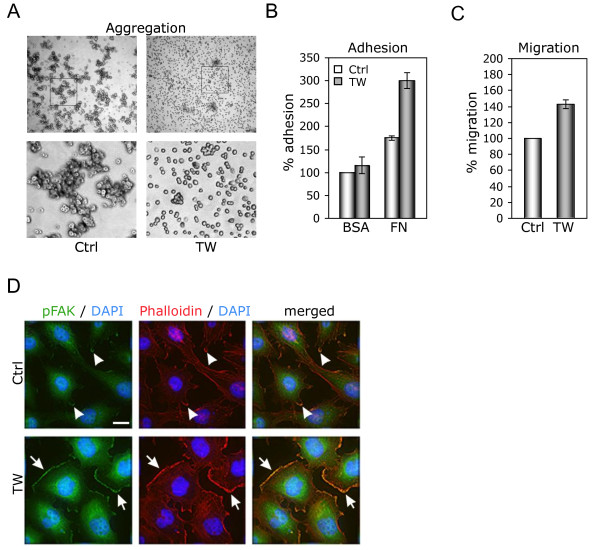
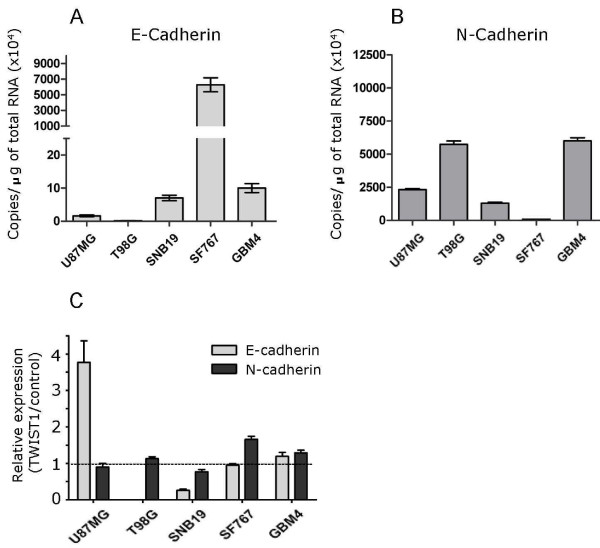
Results: To further define TWIST1 functions in GBM we tested the impact of TWIST1 over-expression on invasion in vivo and its impact on gene expression. We found that TWIST1 significantly increased SNB19 and T98G cell line invasion in orthotopic xenotransplants and increased expression of genes in functional categories associated with adhesion, extracellular matrix proteins, cell motility and locomotion, cell migration and actin cytoskeleton organization. Consistent with this TWIST1 reduced cell aggregation, promoted actin cytoskeletal re-organization and enhanced migration and adhesion to fibronectin substrates. Individual genes upregulated by TWIST1 known to promote EMT and/or GBM invasion included SNAI2, MMP2, HGF, FAP and FN1. Distinct from carcinoma EMT, TWIST1 did not generate an E- to N-cadherin "switch" in GBM cell lines. The clinical relevance of putative TWIST target genes SNAI2 and fibroblast activation protein alpha (FAP) identified in vitro was confirmed by their highly correlated expression with TWIST1 in 39 human tumors. The potential therapeutic importance of inhibiting TWIST1 was also shown through a decrease in cell invasion in vitro and growth of GBM stem cells.

Conclusions: Together these studies demonstrated that TWIST1 enhances GBM invasion in concert with mesenchymal change not involving the canonical cadherin switch of carcinoma EMT. Given the recent recognition that mesenchymal change in GBMs is associated with increased malignancy, these findings support the potential therapeutic importance of strategies to subvert TWIST1-mediated mesenchymal change.


Figures

Figure 1
Figure 1
TWIST1 over-expression increases invasion of SNB19 and T98G cells in organotypic brain slice. (A) Representative low magnification (4×) images of SNB19 Ctrl and TWIST1 (TW) expressing cells cultured on the brain slices (a). Magnified sub-regions indicated by boxes in the top row are shown below (b). Cells invading brain tissue are shown with arrows. Scale bars: 500 and 200 μm. (c) Quantified cell migration is shown on the bar diagram (p = 0.0002). Brain slices were imaged using laser scanning confocal microscopy at equivalent optical planes and analyzed using Metamorph software. (B) (a): Low-magnification photomicrograph of merged fluorescent and DIC channel images. (Left) T98G control (Ctrl) cells generate defined cell aggregates in the brain slice surface. (Right) T98G cells with TWIST1 (TW) over-expression are dispersed as single cells and small non-cohesive aggregates over the brain slice. (b): Representative laser scanning confocal images of T98G Ctrl and T98G TW slices. Images obtained through the entire thickness of the brain slice and 50 μm sections (as indicated by white lines) were digitally reconstructed in the orthogonal plane for analysis of invasive cells. (c) Representative orthogonal views for T98G (Ctrl) and T98G TW are presented as a maximum-intensity projection image. Arrows show cell aggregates on the surface of the slice and arrowheads show invading cells. (d) The results of the analysis of invasive cell density demonstrated a significant increase in the invasion of T98G TW (7564 +/- 1771 cells/mm3) versus T98G control cells (1695 +/- 847 cells/mm3), p = 0.007.
Figure 2
Figure 2
TWIST1 over-expression increased invasiveness of SNB19 cells in vivo. (A) Representative images generated after intracranial injection of GFP-labeled SNB19 Ctrl (left) and SNB19 TW cells (right) show isolated and aggregate cell invasion adjacent to a central tumor core (type 2 growth pattern). Each 3-D confocal image is from a representative individual axial brain slice used for reconstruction of the growth pattern of the total tumor. After imaging and reconstruction, whole brain images were analyzed using Huygens software. The number of invasive aggregates (B), and total volume (VoxVol) of invasive aggregates per tumor (C) were significantly greater in SNB19 TW cells compared with controls (p = 0.0037 and 0.0166, respectively). Arrows demonstrate invasive cell aggregates around central tumor core.
Figure 3
Figure 3
TWIST1 over-expression increased invasiveness of T98G cells in vivo. Equal numbers of GFP-labeled T98G Ctrl and T98G TW cells were injected into SCID mouse brains. At three months, whole brains were isolated and imaged using laser scanning confocal microscopy. For each tumor three optical sections for corresponding levels within each tumor are shown (left -top of the tumor; center - middle of the tumor; right - bottom of the tumor). Dashed white vertical and horizontal lines correspond to anterior border of brain and midline, respectively. The solid red line corresponds to the fixed coronal plane through the site of injection. Whole brain picture (lower left panel) demonstrates site of injection and approximate borders of the confocal images. In contrast to the fixed position of tumor growth at the injection site for the T98G Ctrl tumor, the T98G TW tumor demonstrates a marked degree of tumor cell migration anterior and posterior to the plane of injection and across the midline.
Figure 4
Figure 4
Brightest point projection images (BPI) of tumor growth patterns. The same tumors shown in Figure 3 were analyzed using BPI to visualize global differences in tumor growth patterns. Control T98G and T98G TWIST1 over-expressing tumor images are generated from total of 140 and 164 optical sections, respectively, collected by confocal microscope using ImageJ software. Control tumors possess a more cohesive pattern and localized growth pattern while T98G TW tumors demonstrate a markedly diffuse pattern of growth (type 3 invasive growth pattern). Arrows indicate regions of diffuse T98G TW tumor cell outgrowth.
Figure 5
Figure 5
TWIST1 over-expression results in over-representation of common GO categories related to mesenchymal phenotype and invasion. To characterize changes in gene expression due to TWIST1 over-expression, we compared global gene expression in vector control and TWIST1 over-expressing SNB19 and T98G cells using the Affymetrix GeneChip platform. The analysis revealed many common categories identified by GoMiner (FDR cut-off level <0.1) that are related to mesenchymal function and invasion (cell adhesion, extracellular matrix, cell migration, cell motility and locomotion, and actin cytoskeleton organization) as well as cell-line specific categories consistent with TWIST1 function (transcription and organ development and morphogenesis, e.g.). The number of up- and down-regulated genes in each category is shown. The individual genes that comprise each category are provided in Additional file 4, Table S1.
Figure 6
Figure 6
TWIST1 over-expression produces mesenchymal cellular changes consistent with changes in gene expression. GO analysis of gene expression predicted that TWIST1 would impact cellular phenotype and generate mesenchymal changes relevant to cell invasion. We tested this prediction in SNB19 cells using multiple cell-based assays. (A) TWIST1 inhibits cell aggregation. Representative (4×) image of cell aggregation of SNB19 Ctrl vs SNB19 TW cells (top row). Magnified (20×) sub-regions indicated by boxes in top row are shown below. (B) TWIST1 over-expression promoted adhesion to FN but not BSA-coated plates (shown as percent relative SNB19 control cells; mean ± SE). (C) Migration of SNB19 Tw cells through a filter membrane is increased 40% compared with SNB19 Ctrl cells. (D) Cell morphology, actin cytoskeleton architecture and FAK phosphorylation are altered by TWIST1. Representative (60×) photomicrographs of TWIST1 over-expressing and SNB19 control cells stained with anti-phospho-Tyr397 FAK (pFAK) antibodies (green), phalloidin-TRITC (red) and DAPI (blue). Phospho-FAK co-localization with F-actin along the border of lamellipodia in SNB19 TW and control cells is shown with large arrows and small arrows, respectively. Scale bar = 18 μm.
Figure 7
Figure 7
Confirmation of the microarray results by qRT-PCR. To validate the results from microarray experiments we compared the expression of selected genes related to EMT and/or carcinoma or GBM invasion identified in microarrays (see Tables 1 and Additional file 4, Table S1) with qRT-PCR from mRNA extracted from independent samples of SNB19 (A) and T98G (B) cells with and without TWIST1 over-expression.
Figure 8
Figure 8
TWIST1 over-expression does not generate an E- to N-cadherin switch in GBM cell lines. Absolute quantification of E-cadherin (A) and N-cadherin (B) mRNA expression levels in GBM cells by qRT-PCR demonstrates variable levels of gene expression. Of note, E-cadherin is low or barely detectable in two of five lines tested. (C) Relative quantification of E- and N-cadherin gene expression in GBM cell lines with TWIST1 over-expression relative to control cells transduced with empty vector (accepted as 1 and shown as horizontal line). E-cadherin expression change is not shown for T98G because of expression levels close to background (see panel A). Contrary to carcinoma cells where TWIST1 expression activates a "cadherin switch" TWIST1 over-expression in GBM cell lines did not reduce E-cadherin expression concurrent with increased N-cadherin in any line tested.
Figure 9
Figure 9
Clinical relevance of putative TWIST1 in vitro target genes: SNAI2 and FAP were identified as putative TWIST1 target genes in SNB19 and/or T98G cells. The expression of SNAI2 (A) and FAP (B) are highly correlated with TWIST1 expression in a group of 39 glial tumors of different grade and type including 9 grade II, 3 grade III and 27 grade IV (21 GBM, 6 gliosarcoma (GS) [open circles]) gliomas. ΔCt (dCt) values were determined by qRT-PCR. Correlation coefficients and p values are shown in insets. (C, D, E) The expression levels of TWIST1, SNAI2 and FAP relative to normal brain in different grades of glioma (II+III vs IV) and in the grade IV sub-types (GBM and gliosarcoma (GS)) are shown. Expression of TWIST1, SNAI2 and FAP are higher in grade IV gliomas (GBM and GS) compared to grades II and III combined (p = 0.022, p = 0.0014, p = 0.005, respectively). Analysis of grade IV tumors demonstrated higher levels of TWIST1, SNAI2 and FAP expression in GS compared to GBM (right side of each expression panel) (p = 0.0003, p = 0.0001, p = 0.0014, respectively). Horizontal bars show mean value of expression for each group of tumors. (*, ** p < 0.05). Statistical analysis was performed using log transformed relative expression values.
Figure 10
Figure 10
Inhibition of TWIST1 expression decreases glioma cell invasion and stem cell activity. (A) Top panel: Endogenous levels of TWIST1 protein expression in nuclear extracts from SNB19 cells transduced with shGFP (shCtrl) or shTWIST1 (shTW). Levels of Ini1 protein were used as a loading control for Western blot analysis. Bottom panel: Quantification of SNB19 shTW invasion relative to control cells (shCtrl) accepted as 100%. Representative images of membranes demonstrating reduced invasiveness of SNB19 shTW cells through matrigel relative to control cells are shown. (B) Endogenous levels of TWIST1 protein expression in nuclear extracts from T98G cells transduced with shGFP (shCtrl) or shTWIST1 (shTW). Levels of Ini1 protein were used as a loading control for Western blot analysis. Bottom panel: Quantification of T98G shTW invasion relative to control cells (shCtrl) accepted as 100%. Representative images of membranes demonstrating reduced invasiveness of T98G shTW cells through matrigel relative to control cells are shown. (C) Inhibition of TWIST1 mRNA expression by 80% was achieved in GBM6 glioma stem cells transduced with shTWIST1 resulting in reduced sphere size. (D) Phase contrast image of representative GBM6 spheres transduced with control or TWIST1 specific shRNA lentivirus shows dramatic qualitative reduction in sphere size (E) Quantification of mean sphere diameter in GBM6 control or shTW cells confirms significant decrease in sphere size due to inhibition of TWIST1 expression (p < 0.0001).

References

    1. Kalluri R, Weinberg RA. The basics of epithelial-mesenchymal transition. J Clin Invest. 2009;119:1420–1428. doi: 10.1172/JCI39104. - DOI - PMC - PubMed
    1. Yu W, Kamara H, Svoboda KK. The role of twist during palate development. Dev Dyn. 2008;237:2716–2725. doi: 10.1002/dvdy.21627. - DOI - PubMed
    1. Venkov CD, Link AJ, Jennings JL, Plieth D, Inoue T, Nagai K, Xu C, Dimitrova YN, Rauscher FJ, Neilson EG. A proximal activator of transcription in epithelial-mesenchymal transition. J Clin Invest. 2007;117:482–491. doi: 10.1172/JCI29544. - DOI - PMC - PubMed
    1. Bridges RS, Kass D, Loh K, Glackin C, Borczuk AC, Greenberg S. Gene expression profiling of pulmonary fibrosis identifies Twist1 as an antiapoptotic molecular "rectifier" of growth factor signaling. Am J Pathol. 2009;175:2351–2361. doi: 10.2353/ajpath.2009.080954. - DOI - PMC - PubMed
    1. Yang J, Mani SA, Donaher JL, Ramaswamy S, Itzykson RA, Come C, Savagner P, Gitelman I, Richardson A, Weinberg RA. Twist, a master regulator of morphogenesis, plays an essential role in tumor metastasis. Cell. 2004;117:927–939. doi: 10.1016/j.cell.2004.06.006. - DOI - PubMed

Publication types