. 2010 Nov;63(5):751-61.
doi: 10.1016/j.jaad.2010.02.056. Epub 2010 Jun 19.

Pathologic nodal evaluation improves prognostic accuracy in Merkel cell carcinoma: analysis of 5823 cases as the basis of the first consensus staging system

Affiliations

Pathologic nodal evaluation improves prognostic accuracy in Merkel cell carcinoma: analysis of 5823 cases as the basis of the first consensus staging system

Bianca D Lemos et al. J Am Acad Dermatol. 2010 Nov.

Abstract

Background: The management of Merkel cell carcinoma (MCC) has been complicated by a lack of detailed prognostic data and by the presence of conflicting staging systems.

Objective: We sought to determine the prognostic significance of tumor size, clinical versus pathologic nodal evaluation, and extent of disease at presentation and thereby derive the first consensus staging/prognostic system for MCC.

Methods: A total of 5823 prospectively enrolled MCC cases from the National Cancer Data Base had follow-up data (median 64 months) and were used for prognostic analyses.

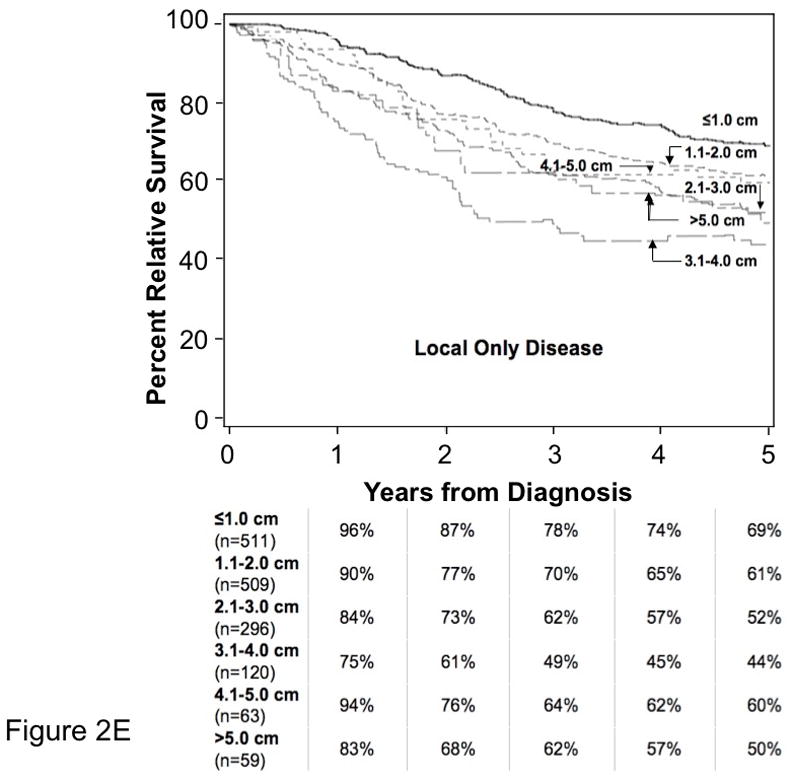
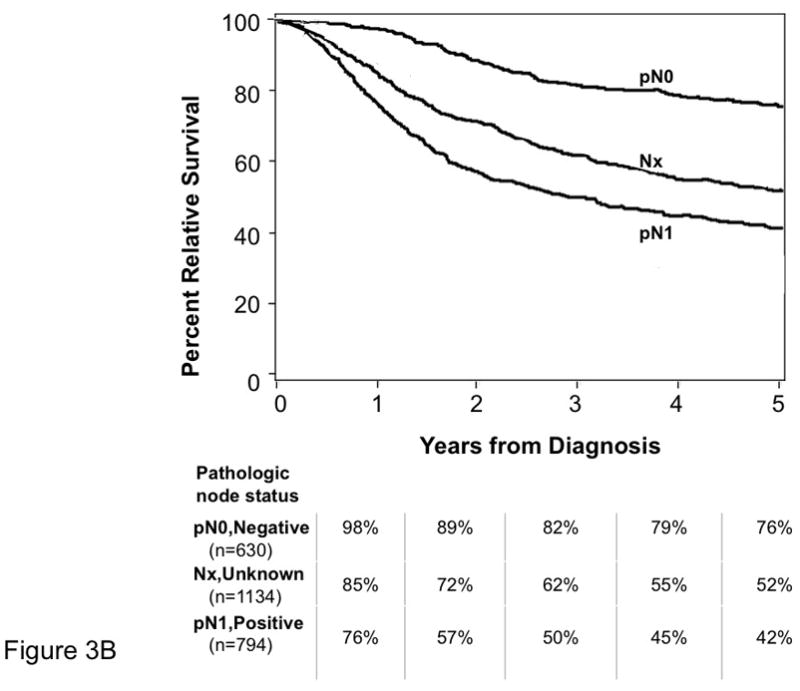
Results: At 5 years, overall survival was 40% and relative survival (compared with age- and sex-matched population data) was 54%. Among all MCC cases, 66% presented with local, 27% with nodal, and 7% with distant metastatic disease. For cases presenting with local disease only, smaller tumor size was associated with better survival (stage I, ≤2 cm, 66% relative survival at 5 years; stage II, >2 cm, 51%; P < .0001). Patients with clinically local-only disease and pathologically proven negative nodes had better outcome (76% at 5 years) than those who only underwent clinical nodal evaluation (59%, P < .0001).

Limitations: The National Cancer Data Base does not capture disease-specific survival. Overall survival for patients with MCC was therefore used to calculate relative survival based on matched population data.

Conclusion: Although the majority (68%) of patients with MCC in this nationwide cohort did not undergo pathologic nodal evaluation, this procedure may be indicated in many cases as it improves prognostic accuracy and has important treatment implications for those found to have microscopic nodal involvement.


Conflict of interest statement

AUTHORS’ DISCLOSURES OF POTENTIAL CONFLICTS OF INTEREST: The author(s) indicated no potential conflicts of interest.

Figures

Figure 1
Figure 1. Flow diagram for MCC cases prospectively captured by the NCDB and extent of available data
There were 10,020 MCC cases captured by the NCDB during 1986–2004. Among those captured prior to the year 2000, 5823 cases had available follow-up data and served as the basis for overall survival and staging analyses. Double boxes indicate groups used for analysis and discussed in this study. As detailed in the Patients and Methods section, cases that had no data in any of the Tumor, Nodal or Metastatic categories (TxNxMx) were eliminated from consideration beyond basic demographic characteristics (Table 1). The effect of Nodal and Tumor status on prognosis was assessed using cases that were negative for distant metastatic disease; therefore, patients with distant metastasis (M1) were excluded from analysis of nodal and primary tumor data. Similarly, cases presenting with pathologically confirmed nodal disease (pN1) were excluded from analysis of primary tumor data, as were those with unknown nodal status (Nx). In total, 2856 cases had available follow-up as well as TNM data sufficient for stage assignment.
Figure 2
Figure 2. Overall and Relative Survival for Merkel Cell Carcinoma
A. Using US census data from 2000 from the National Center for Health Statistics, expected survival (top line) was calculated for a population that was matched for both age and sex with that of the NCDB cohort of MCC patients with follow-up data (n=5823). The lower line represents observed survival for the MCC cohort. MCC-specific deaths cannot be directly determined as the NCDB does not capture data regarding cause of death. An approximation of MCC attributable deaths can be made by subtracting expected mortality for the age- and sex-matched population (non-MCC deaths) from the observed mortality in the cohort. B. Relative survival for all stages of MCC. Percent relative survival was calculated as the ratio at each time point of observed survival in the MCC cohort to expected survival calculated from US census data. C. Relative survival for MCC by extent of disease at time of diagnosis. Percent relative survival was calculated as in Panel B for patients with follow-up who presented with: Local disease (node-negative by clinical or pathologic exam and no distant metastatic disease; n=2356), regional nodal (node-positive by clinical or pathologic exam; n=937) and distant metastatic (n=277) disease. D. Relative Survival by Primary Tumor Size. There were 1558 MCC cases that had available primary tumor size data, at least 5 years of follow-up, and presented with local disease (node negative by pathological or clinical evaluation and no known metastatic disease). These patients were grouped based on the existing AJCC T1-T3 stage categories as indicated in the figure (T4/deep extracutaneous cases were excluded from this analysis). Patients with primary tumors ≤2.0 cm (T1) fared better than tumors >2.0 cm (excess hazard ratio 1.77; 95% confidence interval, 1.4–2.2; p<0.0001). However, among patients with local-only disease, there was no survival difference between 2.1–5.0 cm (T2) and >5.0 cm (T3) groups. E. Relationship of Primary Tumor Size to Relative Survival in MCC Patients with Local-only Disease. Relationship of primary tumor size and survival is plotted for 1558 cases presenting with local-only disease (node negativity as determined by pathologic evaluation if available, or clinical evaluation if not). 84 cases whose primary tumor invaded bone, muscle, fascia or cartilage (T4) were excluded from this analysis. Tumor sizes were grouped into 1-centimeter increments, and relative survival was plotted over 5 years.
Figure 3
Figure 3. Relative Survival by Nodal Status: Clinical vs. Pathologic Evaluation
Age- and sex-adjusted percent relative survival curves are shown for all MCC patients that had ≥ 5 years of follow-up data and did not have distant metastatic disease (n=4427). Patients for whom no regional nodal data were available (1134 cases) are represented by the same curve (Nx) in both panels A and B. Pathologic node-negative status (pN0) was established either by elective lymphadenectomy or by sentinel lymph node biopsy. Pathologic node-positive status (pN1) was established by elective or therapeutic lymphadenectomy, fine needle aspirate, sentinel lymph node or other biopsy technique. The age- and sex-adjusted excess hazard ratio comparing clinical node negative to pathologic node negative (top line in both panels) is 1.80 (95% confidence interval, 1.4–2.4, p<0.0001). The age- and sex-adjusted excess hazard ratio comparing clinical node positive to pathologic node positive (bottom line in both panels) is 1.48 (95% confidence interval, 1.1–1.9, p=0.004). There was very little overlap in data in this cohort for the method of nodal evaluation because patients had only clinical or pathologic nodal data recorded in the majority of cases. Specifically, 240 (5%) of the 4,427 cases included in this analysis had both pathologic and clinical nodal data recorded. These cases are included in the pathologic category (Panel B) and excluded from the clinical nodal analysis (Panel A) because pathologic data was considered to be more accurate.
Figure 4
Figure 4. Relative Survival for MCC by Stage at Presentation in 2856 Patients
Sufficient local, nodal and distant data were available for stage classification of 2856 MCC patients as summarized in Figure 1. Cases presenting with local disease (Panel A) or regional nodal/distant metastatic disease (Panel B) are shown by sub-stages with annual percent relative survival below each panel. Stages are as indicated directly on the survival curves except for Stage IIIA (microscopic node positive, clinical node negative) which could not be derived using the NCDB dataset as described in the Discussion section. The curve marked “IIIA*” represents pathologically node positive patients whose clinical node status was unknown (pN1, cNx). It is anticipated that true Stage IIIA patients with known clinically negative node status (pN1, cN0) may have better survival than the line marked “IIIA*” (pN1, cNx).

Similar articles

Cited by

References

    1. Hodgson NC. Merkel cell carcinoma: changing incidence trends. J Surg Oncol. 2005;89(1):1–4. - PubMed
    1. Lemos B, Nghiem P. Merkel cell carcinoma: more deaths but still no pathway to blame. J Invest Dermatol. 2007;127(9):2100–3. - PubMed
    1. Feng H, Shuda M, Chang Y, Moore PS. Clonal integration of a polyomavirus in human Merkel cell carcinoma. Science. 2008;319(5866):1096–100. - PMC - PubMed
    1. Engels EA, Frisch M, Goedert JJ, Biggar RJ, Miller RW. Merkel cell carcinoma and HIV infection. Lancet. 2002;359(9305):497–8. - PubMed
    1. Heath ML, Jaimes N, Lemos B, et al. Clinical characteristics of Merkel cell carcinoma at diagnosis in 195 patients: the AEIOU features. J Am Acad Dermatol. 2008;58(3):375–81. - PMC - PubMed

Publication types