Clinical Trial
. 2010 Dec 1;78(5):1356-65.
doi: 10.1016/j.ijrobp.2009.10.002. Epub 2010 Jun 18.

Candidate dosimetric predictors of long-term swallowing dysfunction after oropharyngeal intensity-modulated radiotherapy

Affiliations
Clinical Trial

Candidate dosimetric predictors of long-term swallowing dysfunction after oropharyngeal intensity-modulated radiotherapy

David L Schwartz et al. Int J Radiat Oncol Biol Phys. .

Abstract

Purpose: To investigate long-term swallowing function in oropharyngeal cancer patients treated with intensity-modulated radiotherapy (IMRT), and to identify novel dose-limiting criteria predictive for dysphagia.

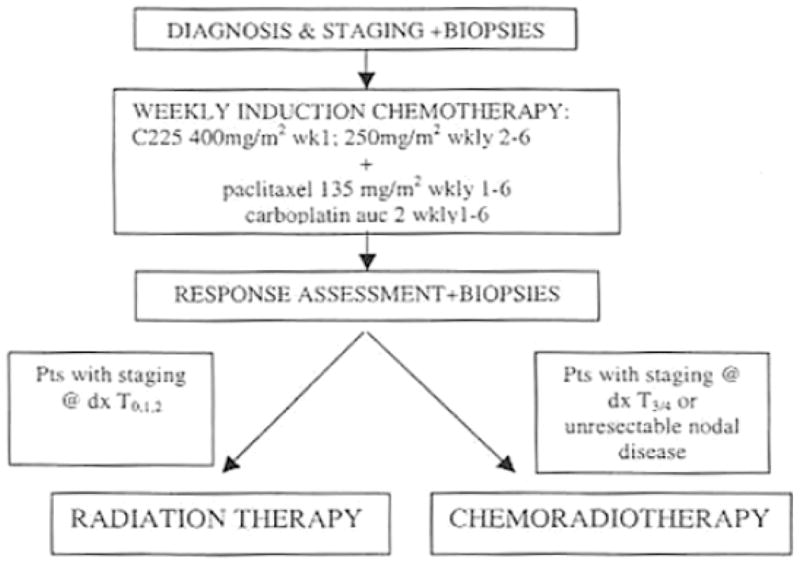
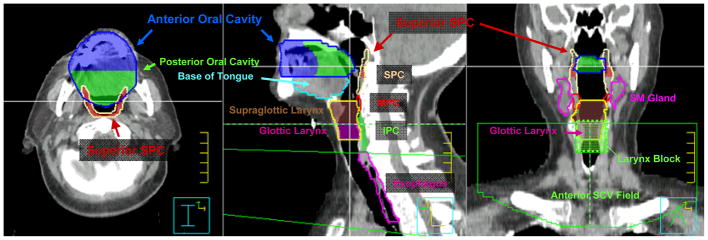
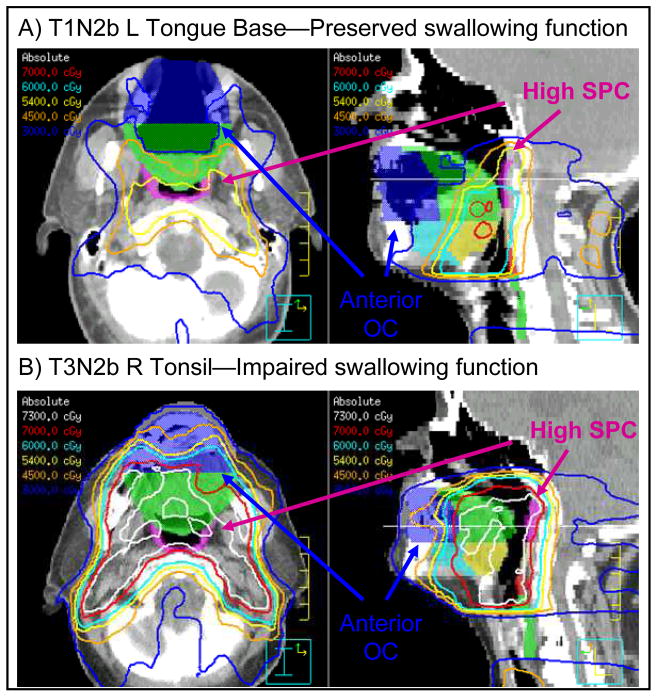
Methods and materials: Thirty-one patients with Stage IV oropharyngeal squamous carcinoma enrolled on a Phase II trial were prospectively evaluated by modified barium swallow studies at baseline, and 6, 12, and 24 months post-IMRT treatment. Candidate dysphagia-associated organs at risk were retrospectively contoured into original treatment plans. Twenty-one (68%) cases were base of tongue and 10 (32%) were tonsil. Stage distribution was T1 (12 patients), T2 (10), T3 (4), T4 (2), and TX (3), and N2 (24), N3 (5), and NX (2). Median age was 52.8 years (range, 42-78 years). Thirteen patients (42%) received concurrent chemotherapy during IMRT. Thirteen (42%) were former smokers. Mean dose to glottic larynx for the cohort was limited to 18 Gy (range, 6-39 Gy) by matching IMRT to conventional low-neck fields.

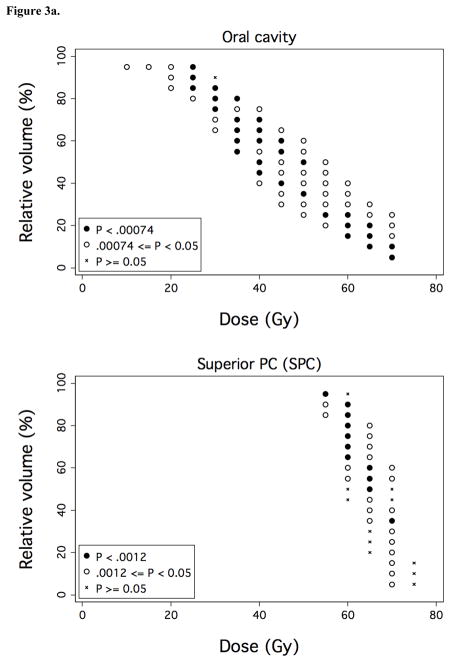
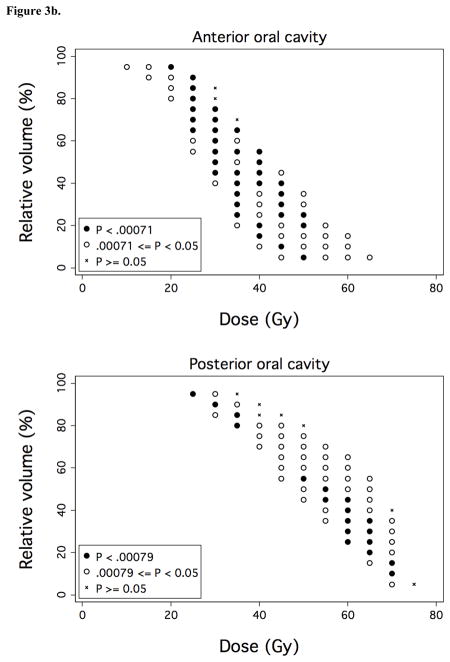
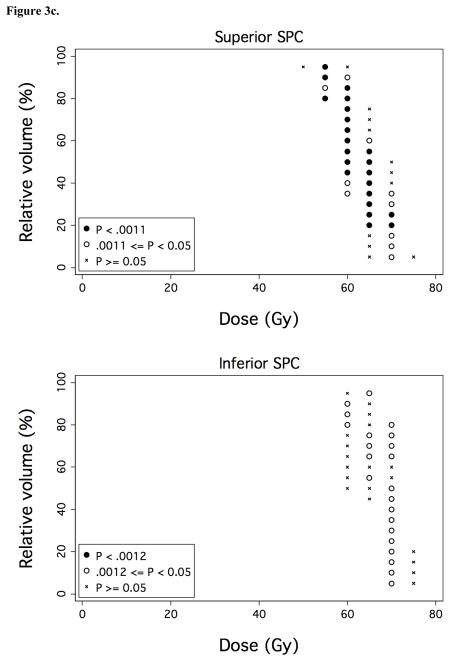
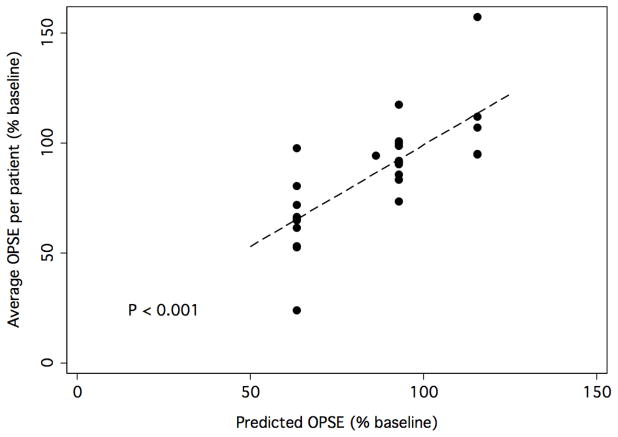
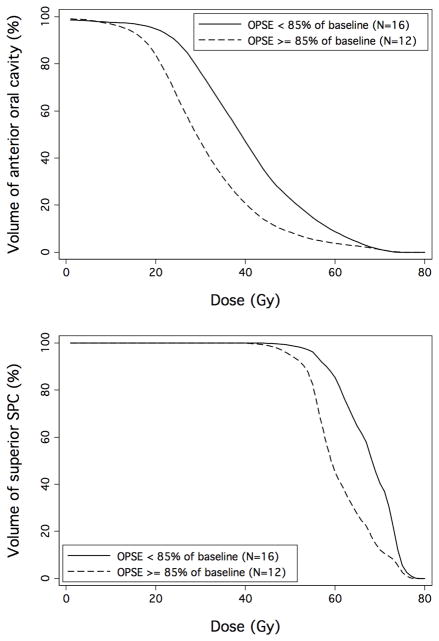
Results: Dose-volume constraints (V30 < 65% and V35 < 35% for anterior oral cavity and V55 < 80% and V65 < 30% for high superior pharyngeal constrictors) predictive for objective swallowing dysfunction were identified by univariate and multivariate analyses. Aspiration and feeding tube dependence were observed in only 1 patient at 24 months.

Conclusions: In the context of glottic laryngeal shielding, we describe candidate oral cavity and superior pharyngeal constrictor organs at risk and dose-volume constraints associated with preserved long-term swallowing function; these constraints are currently undergoing prospective validation. Strict protection of the glottic larynx via beam-split IMRT techniques promises to make chronic aspiration an uncommon outcome.


Conflict of interest statement

Conflict of Interest Notification: The authors report no conflict of interest.

Figures

Figure 1
Figure 1
Protocol treatment pathway for study cohort
Figure 2
Figure 2. Candidate dysphagia-specific OAR volumes
The superior pharyngeal constrictor (SPC) volume (tan) is defined from the skull base to superior edge of the hyoid bone. The SPC volume (dark red) residing above the inferior edge of C1 is defined as superior SPC. The middle pharyngeal constrictor (MPC) volume (red) extends from superior hyoid to the inferior edge of the hyoid. The inferior pharyngeal constrictor (IPC) volume (green) extends from below the hyoid to the level of the cricopharyngeus muscle at the inferior edge of the cricoid cartilage. The oral cavity is subdivided into equal anterior (blue) and posterior (green) halves for subregional analysis. The glottic larynx (magenta) is distinguished from supraglottic larynx (brown) as laryngeal volume residing between the top of the arytenoid cartilages and the bottom of the cricoid cartilage. For all patients, IMRT was matched at the superior aspect of the arytenoids to a conventional AP SCV field with a 3 × 3 cm larynx block, treated to 50 Gy in 25 daily fractions. The larynx block was extended inferiorly to the lower border of the AP SCV field to become a full length midline spinal cord block after 40–42 Gy. SCV = AP supraclavicular field, SM gland = submandibular gland.
Figure 3
Figure 3. Associations between OAR dose-volume thresholds and OPSE outcomes
Over a comprehensive range of dose (D) and relative volume (V%), normalized post-RT OPSE values were compared in the patient groups with VD > V% versus VD ≤ V%, where VD denotes the relative volume of the OAR exposed to doses > D Gy. Results are plotted as grid plots to indicate statistical significance of each dose-volume combination received by cohort patients. Dose-volume constraints significantly associated with OPSE outcomes following Bonferroni correction are designated by closed circles (●). a) Oral cavity and SPC. b) Anterior and posterior oral cavity subregion. c) Superior and inferior SPC subregion.
Figure 4
Figure 4. Illustration of the model of OPSE as a function of dose-volume constraints for anterior oral cavity and superior SPC
Forward stepwise multivariate analysis found two threshold values to be significantly and independently associated with an increased risk for reduced OPSE scores: 1) V30 > 65% for anterior oral cavity and 2) V55 > 80% for superior SPC. The graph demonstrates the relationship between predicted and observed OPSE (% of baseline, average per patient) for the model incorporating these two dose-volume constraints.
Figure 5
Figure 5
Average anterior oral cavity and superior SPC DVH curves for patients dichotomized according to post-treatment OPSE scores < or ≥ 85% of baseline
Figure 6
Figure 6. Representative examples of candidate dysphagia OAR volumes within context of IMRT treatment plans
Oral cavity OAR has been subdivided into equal anterior (dark blue) and posterior (green) halves. The SPC has been divided into superior (magenta) and inferior (tan) subregions at the inferior edge of the C1 vertebral body. Additional OARs can be seen demarcating anterior (light blue) and posterior (yellow) tongue base, MPC (red), and IPC (green). OARs are demonstrated within IMRT treatment plans for two patients with equivalent larynx dose sparing and divergent swallowing function outcomes. A) T1N2b disease of low left tongue base. Anterior oral cavity and high SPC dose sparing can be appreciated. An 84% improvement in OPSE from baseline was measured at 24 months. B) Bulky T3N2b right tonsillar carcinoma with extension into soft palate and tongue base, necessitating high dose coverage of anterior oral cavity and high SPC. A 40% decrease in OPSE from baseline was observed at 24 months.

References

    1. Argiris A, Karamouzis MV, Raben D, et al. Head and neck cancer. Lancet. 2008;371:1695–1709. - PMC - PubMed
    1. Eisbruch A, Lyden T, Bradford CR, et al. Objective assessment of swallowing dysfunction and aspiration after radiation concurrent with chemotherapy for head-and-neck cancer. Int J Radiat Oncol Biol Phys. 2002;53:23–28. - PubMed
    1. Rademaker AW, Vonesh EF, Logemann JA, et al. Eating ability in head and neck cancer patients after treatment with chemoradiation: a 12-month follow-up study accounting for dropout. Head Neck. 2003;25:1034–1041. - PubMed
    1. Mittal BB, Pauloski BR, Haraf DJ, et al. Swallowing dysfunction--preventative and rehabilitation strategies in patients with head-and-neck cancers treated with surgery, radiotherapy, and chemotherapy: a critical review. Int J Radiat Oncol Biol Phys. 2003;57:1219–1230. - PubMed
    1. Chao KS, Wippold FJ, Ozyigit G, et al. Determination and delineation of nodal target volumes for head-and-neck cancer based on patterns of failure in patients receiving definitive and postoperative IMRT. Int J Radiat Oncol Biol Phys. 2002;53:1174–1184. - PubMed

Publication types

MeSH terms