. 2010 Oct 15;49(7):1230-7.
doi: 10.1016/j.freeradbiomed.2010.07.009. Epub 2010 Jul 18.

SIRT3 is regulated by nutrient excess and modulates hepatic susceptibility to lipotoxicity

Affiliations

SIRT3 is regulated by nutrient excess and modulates hepatic susceptibility to lipotoxicity

Jianjun Bao et al. Free Radic Biol Med. .

Abstract

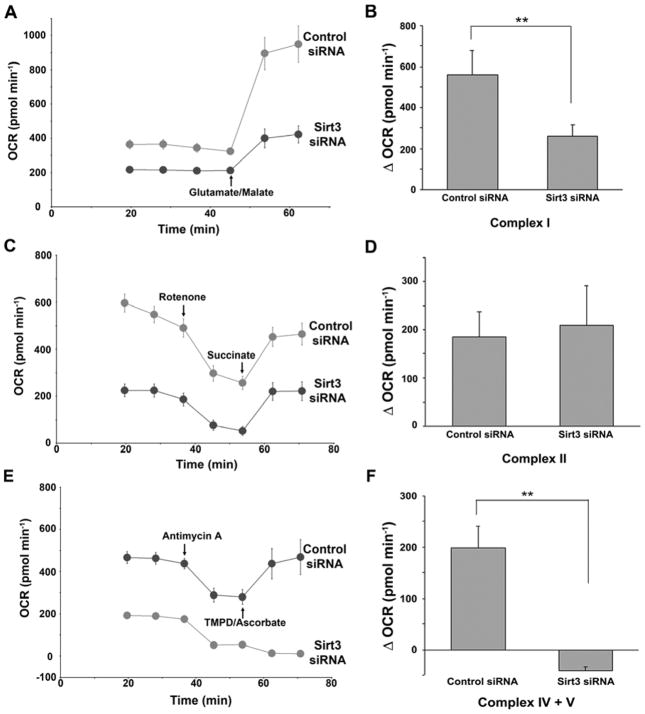
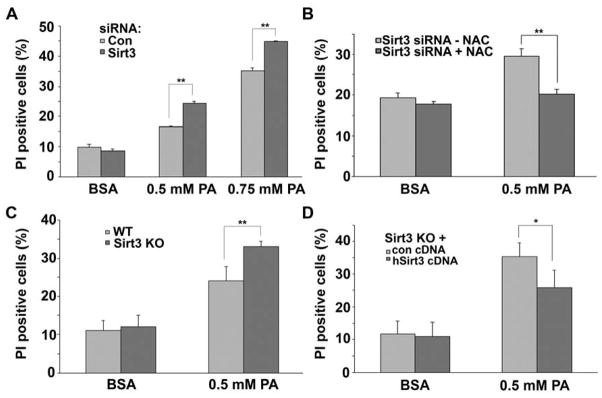
SIRT3 is the primary mitochondrial deacetylase that modulates mitochondrial metabolic and oxidative stress regulatory pathways. However, its role in response to nutrient excess remains unknown. Thus, we investigated SIRT3 regulation of the electron transfer chain and evaluated the role of SIRT3 in hepatic lipotoxic stress. SIRT3-depleted HepG2 cells show diffuse disruption in mitochondrial electron transfer chain functioning, a concurrent reduction in the mitochondrial membrane potential, and excess basal reactive oxygen species levels. As this phenotype may predispose to increased lipotoxic hepatic susceptibility we evaluated the expression of SIRT3 in murine liver after chronic high-fat feeding. In this nutrient-excess model SIRT3 transcript and protein levels are downregulated in parallel with increased hepatic fat storage and oxidative stress. Palmitate was used to investigate lipotoxic susceptibility in SIRT3 knockout mouse primary hepatocytes and SIRT3-siRNA-transfected HepG2 cells. Under SIRT3-deficient conditions palmitate enhances reactive oxygen species and increases hepatocyte death. Reconstitution of SIRT3 levels and/or treatment with N-acetylcysteine ameliorates these adverse effects. In conclusion SIRT3 functions to ameliorate hepatic lipotoxicity, although paradoxically, exposure to high fat downregulates this adaptive program in the liver. This SIRT3-dependent lipotoxic susceptibility is possibly modulated, in part, by SIRT3-mediated control of electron transfer chain flux.


Figures

Figure 1
Figure 1. SIRT3 regulates mitochondrial functions in hepatic cells
(A) Immunoblot analysis of SIRT3 expression levels in HepG2 cells transfected with control or SIRT3 siRNA for 72 hours. F0F1-ATPase subunit α was used as loading controls. (B) Immunoblot analysis shows the absence of SIRT3 in primary knockout (KO) hepatocytes and the capacity to reconstitute SIRT3 levels following transfection studies. (C) Intact cellular basal oxygen consumption rates (OCR) of control or SIRT3 siRNA-treated HepG2 cells, wild type (WT) or SIRT3 KO hepatocytes, and SIRT3 KO hepatocytes transfected with pcDNA3.1 or plasmid encoding hSIRT3 measured by Seahorse XF24 analyzer. (D) Steady-state cellular ATP levels in control or SIRT3 siRNA-treated HepG2 cells. Data represent mean ± SEM from four independent experiments. (E) Comparison of mitochondrial membrane potential in control or SIRT3 siRNA-treated HepG2 cells, as measured by TMRM. (F) Representative traces of ROS production as indicated by DCF fluorescence intensity in control or SIRT3 siRNA-treated HepG2 cells.
Figure 2
Figure 2. SIRT3 regulates mitochondrial electron transfer chain activities
Left, representative traces of OCRs in control or SIRT3 siRNA-treated, digitonin-permealized HepG2 cells follow the addition of glutamate/malate (A), succinate (C), or TMPD/ascorbate (E). The quantification of OCR change in each group was shown in the right of respective figures. B, D, and F, Data represent average of 10 replicates from one plate ± SD, each experiment repeated at least three times. **, p<0.01.
Figure 3
Figure 3. Effects of long term high fat diet on hepatic SIRT3 expression and oxidative stress
(A) Representative images of oil red O staining of liver sections from mice fed with normal diet or high fat diet for four months. (B) Nitrotyrosine staining (red) of liver sections as described in A. The nuclei were counterstained with DAPI (blue). (C) Liver SIRT3 mRNA expression levels in four month chow diet or high fat diet-fed mice, as quantified by qPCR. Data represent mean ± SEM, n = 5 for chow diet, and n = 8 for high fat diet-fed mice. **, p<0.01. (D) Immunoblot analysis of SIRT3 protein expression levels in mouse liver total proteins as described above. β-tubulin was used as loading controls.
Figure 4
Figure 4. A. Palmitate modulates oxygen consumption and ROS levels in a SIRT3-dependent manner
(A) Oxygen consumption of control or SIRT3 siRNA-treated HepG2 cells in response to 0.1 % BSA or 0.1 mM palmitate (PA). Data represent average of 5 replicates from one plate ± SD, each experiment repeated at least three times. (B) Mitochondrial superoxide production of control or SIRT3 siRNA-treated HepG2 cells in the absence or presence of 0.5 % BSA or 0.5 mM PA. Data mean ± SEM from 10 measurements and are representative of at least 3 independent experiments. (C) ROS production in WT and SIRT3 KO primary hepatocytes in the absence and presence of 0.5 mM PA. The data were expressed as the percentage of maximal slope compared to WT control cells. Data represent mean ± SEM from three independent experiments. (D) ROS production in control or SIRT3 siRNA-treated HepG2 cells in the absence or presence of 0.5 mM PA and/or 10 mM NAC. The data were expressed as the percentage of maximal slope compared to control siRNA-treated HepG2 cells. Data represent mean ± SEM from four independent experiments. *, p<0.05, **, p<0.01.
Figure 5
Figure 5. Oxidative stress partially mediates SIRT3-dependent lipotoxicity
(A) Cell viability of control or SIRT3 siRNA-transfected HepG2 cells following treatment of BSA or different amounts of palmitate (PA). The dead cells are identified as propidium iodide (PI)-positive cells and quantified by FACS analysis. Data represent mean ± SEM of four independent experiments. (B) Cell viability of control or SIRT3 siRNA-treated HepG2 cells with or without pretreatment of 10mM NAC, followed by incubation with 0.5 mM PA for 24 hours. Data represent mean ± SEM from four independent experiments. (C) Cell viability of primary WT and SIRT3 KO hepatocytes following treatment of BSA or 0.5 mM palmitate (PA). (D) Cell viability of pcDNA3.1 or hSIRT3 cDNA-transfected SIRT3 KO hepatocytes treated with 0.5 mM PA. Data represent mean ± SEM of three independent primary cell studies for each group in C and D. A–D, **, p<0.01.

References

    1. Kim SC, Sprung R, Chen Y, Xu Y, Ball H, Pei J, et al. Substrate and functional diversity of lysine acetylation revealed by a proteomics survey. Mol Cell. 2006;23:607–18. - PubMed
    1. Zhang J, Sprung R, Pei J, Tan X, Kim S, Zhu H, et al. Lysine acetylation is a highly abundant and evolutionarily conserved modification in Escherichia coli. Mol Cell Proteomics. 2009;8:215–25. - PMC - PubMed
    1. Zhao S, Xu W, Jiang W, Yu W, Lin Y, Zhang T, et al. Regulation of cellular metabolism by protein lysine acetylation. Science. 2010;327:1000–4. - PMC - PubMed
    1. Ahn BH, Kim HS, Song S, Lee IH, Liu J, Vassilopoulos A, et al. A role for the mitochondrial deacetylase Sirt3 in regulating energy homeostasis. Proc Natl Acad Sci U S A. 2008;105:14447–52. - PMC - PubMed
    1. Lombard DB, Alt FW, Cheng HL, Bunkenborg J, Streeper RS, Mostoslavsky R, et al. Mammalian Sir2 homolog SIRT3 regulates global mitochondrial lysine acetylation. Mol Cell Biol. 2007;27:8807–14. - PMC - PubMed

Publication types

MeSH terms