. 2010 Oct;20(10):1459-68.
doi: 10.1101/gr.108175.110. Epub 2010 Jul 20.

The ANISEED database: digital representation, formalization, and elucidation of a chordate developmental program

Affiliations

The ANISEED database: digital representation, formalization, and elucidation of a chordate developmental program

Olivier Tassy et al. Genome Res. 2010 Oct.

Abstract

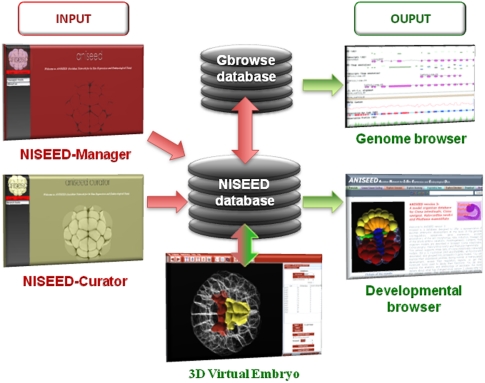
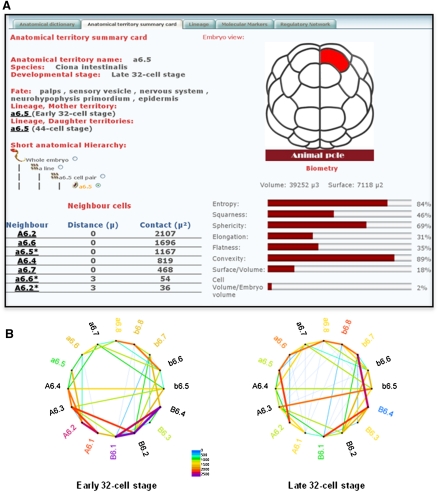
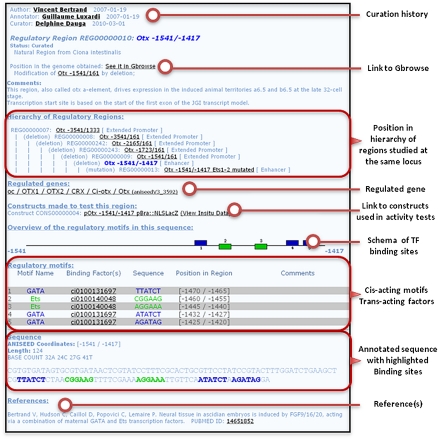
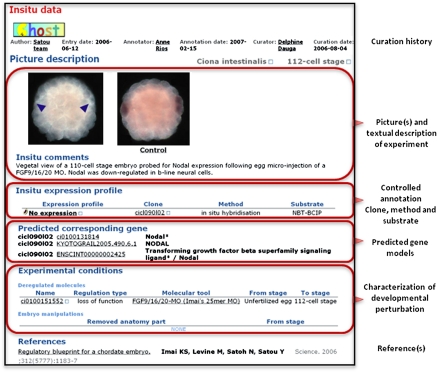
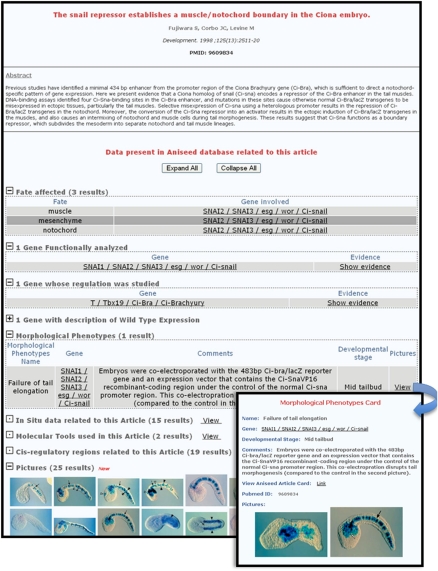
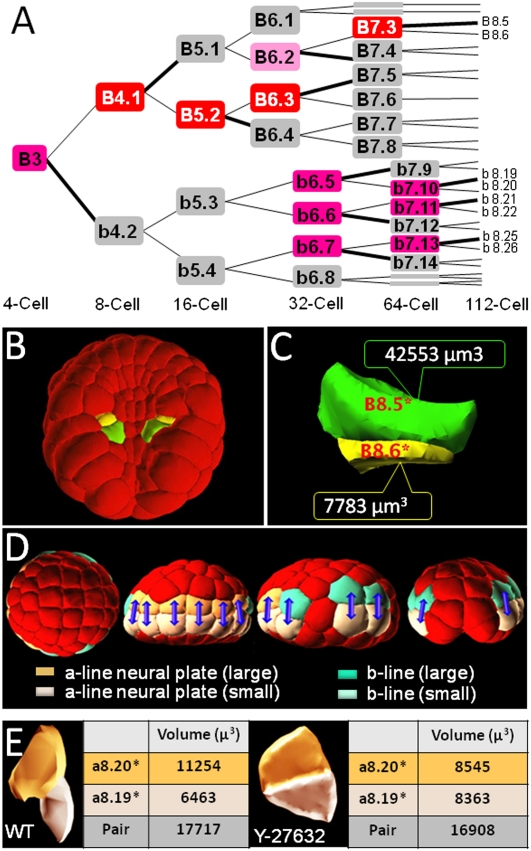
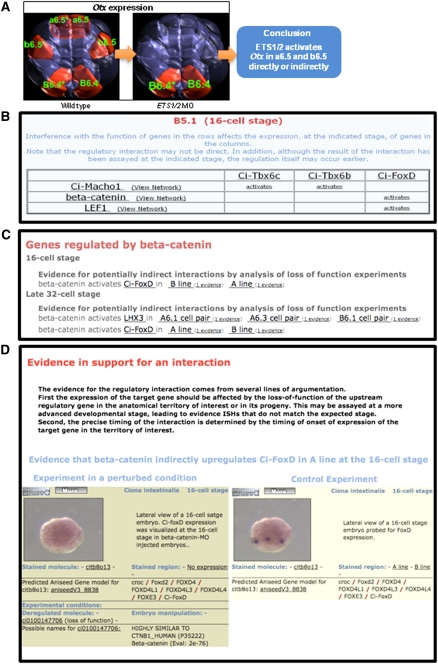
Developmental biology aims to understand how the dynamics of embryonic shapes and organ functions are encoded in linear DNA molecules. Thanks to recent progress in genomics and imaging technologies, systemic approaches are now used in parallel with small-scale studies to establish links between genomic information and phenotypes, often described at the subcellular level. Current model organism databases, however, do not integrate heterogeneous data sets at different scales into a global view of the developmental program. Here, we present a novel, generic digital system, NISEED, and its implementation, ANISEED, to ascidians, which are invertebrate chordates suitable for developmental systems biology approaches. ANISEED hosts an unprecedented combination of anatomical and molecular data on ascidian development. This includes the first detailed anatomical ontologies for these embryos, and quantitative geometrical descriptions of developing cells obtained from reconstructed three-dimensional (3D) embryos up to the gastrula stages. Fully annotated gene model sets are linked to 30,000 high-resolution spatial gene expression patterns in wild-type and experimentally manipulated conditions and to 528 experimentally validated cis-regulatory regions imported from specialized databases or extracted from 160 literature articles. This highly structured data set can be explored via a Developmental Browser, a Genome Browser, and a 3D Virtual Embryo module. We show how integration of heterogeneous data in ANISEED can provide a system-level understanding of the developmental program through the automatic inference of gene regulatory interactions, the identification of inducing signals, and the discovery and explanation of novel asymmetric divisions.


Figures

Figure 1.
Figure 1.
Overview of the architecture of the NISEED system. (Arrows) Direction of information flow. Supplemental Figures S1 and S2 present the search interfaces in more details.
Figure 2.
Figure 2.
Representation of embryonic anatomy. (A) Screenshot of an anatomical territory card representing the lineage, fate, position/contacts with neighbors, and geometry of the a6.5 cell at the early 32-cell stage. Note the tabs at the top of the screen capture that lead to the whole anatomical ontology for the stage of interest (“Anatomical Ontology”), to the precursors and progeny of the territory of interest (“Lineage”), to expression profiles restricted to this territory (“Molecular Markers”), and to the regulatory interactions that take place in the lineage leading to this territory (“Regulatory Network”). (B) Neighborhood graph showing which cells of the late 32-cell embryo contact each other. The nodes of the graph represent individual cells, the edges represent contacts. The thickness of the edge reflects the area of contact between adjacent cells. The indicated values are in square microns. Supplemental Figures S3 and S4 give more details about the description of ascidian anatomy in ANISEED.
Figure 3.
Figure 3.
Representation of cis-regulatory information. Screenshot of the regulatory region card for the early minimal neural enhancer of Ciona intestinalis Otx. The precise pattern of activity of this region is accessed by clicking on the “view in situ data” link located in the “Constructs made to test this region” section. Supplemental Figure S6 presents the classification system for cis-regulatory regions used in ANISEED.
Figure 4.
Figure 4.
Representation of spatial expression patterns. Screenshot of the expression card describing the expression of the Ciona intestinalis Nodal gene at the early gastrula stage, in response to the inhibition of FGF9/16/20 function. Note the control picture that was taken in the same experiment; clicking on the “control” word leads to the description of the expression in wild-type conditions.
Figure 5.
Figure 5.
The article card. Screenshot of an example of an article card showing the various types of information recapitulating the scientific message of the article. (Inset) Description of the morphological phenotype caused by the inhibition of Ci-snail function.
Figure 6.
Figure 6.
Systematic identification of unequal cell cleavages: (A) Lineage tree for the B3 (posterior) blastomere between the four-cell and the 112-cell stages in Ciona intestinalis. The only blastomeres named are in lineages where unequal divisions occur. (Gray) Cells that divide symmetrically, (light pink) cells with weak asymmetry (index > 15%; Tassy et al. 2006), (pink) cells with marked asymmetry (index > 25%), (red) cells with strong asymmetry (>50%). Supplemental Figure S7 shows all asymmetric divisions up to the 112-cell stage. (B,C) Example of asymmetry between the 64- and 112-cell stages in the vegetal hemisphere of Ciona intestinalis embryos. The yellow (B8.6) and green (B8.5) cells are daughters of the same mother cell (B7.3). Note the important difference in cell volumes between the two sisters. This unequal division is conserved in Halocynthia roretzi (Darras and Nishida 2001). (D) Position of unequally cleaving animal cells between the 76- and 112-cell stages. From the left: animal view, anterior is to the left; frontal view, animal is to the top; lateral view, anterior is to the left, animal to the top; posterior view, animal is to the top. (Blue arrows) Sister cells are linked. (Colors) Lineage and size of cells (see legend). (E) Effect of the inhibition of endoderm invagination with the Rho-kinase inhibitor Y-27632. Side views of the a8.19/a8.20 cell pair in wild-type and Y-treated conditions are shown, as well as a measure of the mean volumes of these cells in the two embryos analyzed.
Figure 7.
Figure 7.
Automatic inference of transcriptional regulatory interactions. (A) Example of the inference logic that led to the establishment of a regulatory interaction between ETS1/2 and Otx in a6.5 and b6.5 neural precursors at the late 32-cell stage. Use of an antisense Morpholino oligonucleotide is interpreted as a loss-of-function experiment. Territories in which Otx expression is lost are thus territories where ETS1/2 regulates Otx expression. (B) Screenshot of the “Anatomy Regulation” card for the B5.1 precursor at the 16-cell stage, showing the regulatory interactions that take place in the lineage leading to this blastomere. (C) Screenshot of the “Downstream Target” card of beta-catenin, showing transcriptional targets of this gene at the 16-cell and late 32-cell stages. Note that the anatomical territories in which the regulatory interactions are confirmed as indicated. (D) Screenshot of the page presenting the evidence that beta-catenin upregulates Ci-FoxD in the A-line at the 16-cell stage. Supplemental Figure S9 presents the number of inferred regulatory links at each developmental stage.

References

    1. Audic S, Claverie JM 1997. The significance of digital gene expression profiles. Genome Res 7: 986–995 - PubMed
    1. Bertrand V, Hudson C, Caillol D, Popovici C, Lemaire P 2003. Neural tissue in ascidian embryos is induced by FGF9/16/20, acting via a combination of maternal GATA and Ets transcription factors. Cell 115: 615–627 - PubMed
    1. Birney E, Andrews D, Caccamo M, Chen Y, Clarke L, Coates G, Cox T, Cunningham F, Curwen V, Cutts T, et al. 2006. Ensembl 2006. Nucleic Acids Res 34: D556–D561 - PMC - PubMed
    1. Blake JA, Richardson JE, Davisson MT, Eppig JT 1997. The Mouse Genome Database (MGD). A comprehensive public resource of genetic, phenotypic and genomic data. The Mouse Genome Informatics Group. Nucleic Acids Res 25: 85–91 - PMC - PubMed
    1. Blanchard GB, Kabla AJ, Schultz NL, Butler LC, Sanson B, Gorfinkiel N, Mahadevan L, Adams RJ 2009. Tissue tectonics: Morphogenetic strain rates, cell shape change and intercalation. Nat Methods 6: 458–464 - PMC - PubMed

Publication types

MeSH terms

LinkOut - more resources