. 2010 Oct 1;19(19):3693-701.
doi: 10.1093/hmg/ddq284. Epub 2010 Jul 20.

Deducing the pathogenic contribution of recessive ABCA4 alleles in an outbred population

Affiliations

Deducing the pathogenic contribution of recessive ABCA4 alleles in an outbred population

Emily I Schindler et al. Hum Mol Genet. .

Abstract

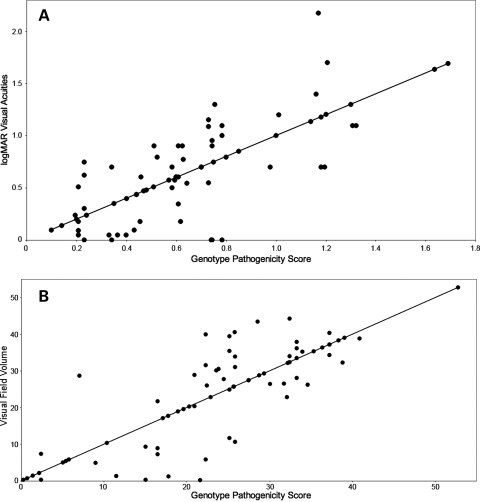
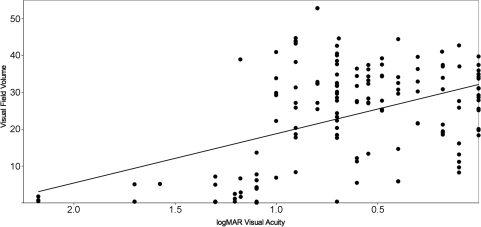
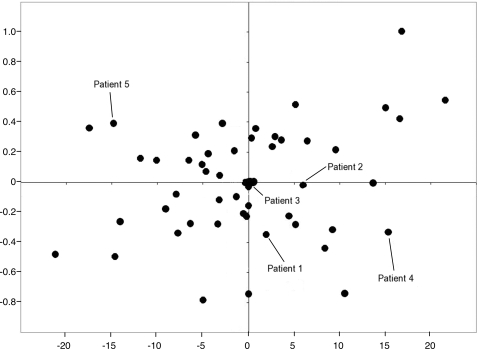
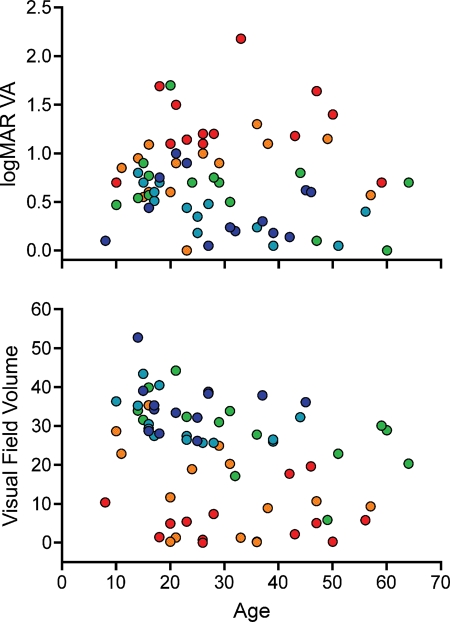
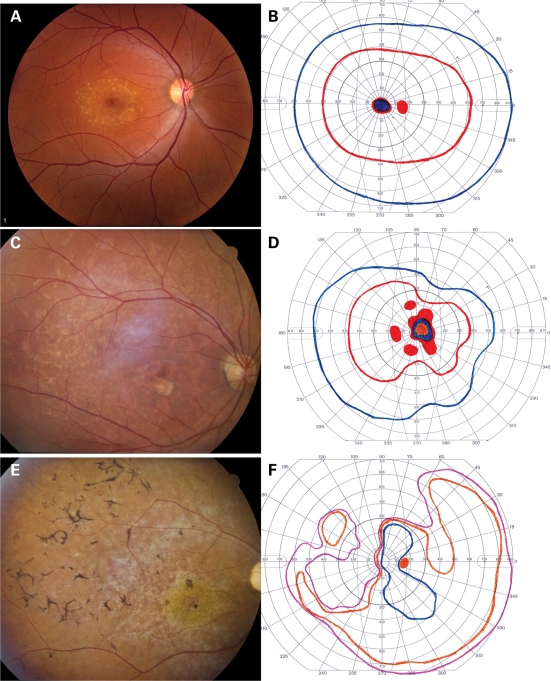
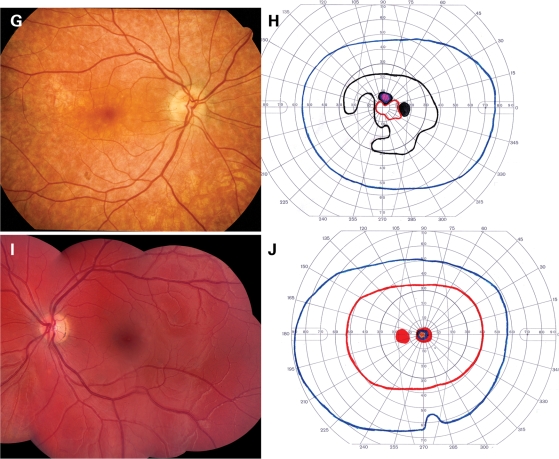
Accurate prediction of the pathogenic effects of specific genotypes is important for the design and execution of clinical trials as well as for meaningful counseling of individual patients. However, for many autosomal recessive diseases, it can be difficult to deduce the relative pathogenic contribution of individual alleles because relatively few affected individuals share the same two disease-causing variations. In this study, we used multiple regression analysis to estimate the pathogenicity of specific alleles of ABCA4 in patients with retinal phenotypes ranging from Stargardt disease to retinitis pigmentosa. This analysis revealed quantitative allelic effects on two aspects of the visual phenotype, visual acuity (P < 10(-3)) and visual field (P < 10(-7)). Discordance between visual acuity and visual field in individual patients suggests the existence of at least two non-ABCA4 modifying factors. The findings of this study will facilitate the discovery of factors that modify ABCA4 disease and will also aid in the optimal selection of subjects for clinical trials of new therapies.


Figures

Figure 1.
Figure 1.
Correlation of phenotype and genotype. (A) The correlation (R2 = 0.56) of the sum of allelic regression coefficients (genotype pathogenicity score) with the best-corrected visual acuity expressed as the log of the minimum angle of resolution. (B) The correlation (R2= 0.68) of the sum of allelic regression coefficients with the visual field volume score (see Materials and Methods).
Figure 2.
Figure 2.
Correlation of visual acuity and visual field. The average visual acuity measurement from each patient is given on the x-axis and the average visual field measurement from each patient is given on the y-axis. The relatively poor correlation between these values (R2= 0.20) is an indication that non-ABCA4 modifying factors exist that have different effects on these two measures of visual function.
Figure 3.
Figure 3.
Comparison of residual values from the visual acuity and visual field regression analyses. The residual values from the visual acuity regression analysis are given on the x-axis, while those of the visual field regression analysis are given on the y-axis. Individuals represented to the left of the y-axis have visual fields that are better than expected for their genotype while those to the right of the y-axis have visual fields that are worse than expected. Individuals above the x-axis have visual acuities that are poorer than expected for their genotype, while individuals below the x-axis have visual acuities better than expected. The residuals of the five patients depicted in Figure 5 are specifically labeled. The R2 value for these data is 0.06.
Figure 4.
Figure 4.
Visual function over time. (A) The visual acuity values (y-axis) used for the multiple regression analysis plotted with respect to age. Each individual's genotype score (sum of their allelic coefficients) is indicated by color with the mildest quintile shown in dark blue and the remaining quintiles in the increasing order of severity shown in light blue, green, orange and red. (B) Similar presentation of the visual field values. In both panels, better visual function is at the top of the figure and poorer visual function is at the bottom. The majority of the difference in visual function among these five quintiles of ABCA4 genotype occurs before age 20.
Figure 5.
Figure 5.
Fundus photographs and Goldman visual fields of five patients with ABCA4-associated retinal disease. The patients depicted in the upper 10 panels have acuities and visual fields that are completely predicted by the additive effects of their ABCA4 alleles. The patient depicted in (G) and (H) has better visual acuity and poorer visual fields than expected for her genotype, while the patient depicted in (I) and (J) has poorer visual acuity and better fields than expected. (A) and (B) depict the left eye of a 27-year-old woman with a mild ABCA4 genotype, 20/30 acuity and a visual field score of 37.5; (C) and (D) depict the right eye of an 24-year-old man with a moderate ABCA4 genotype, 20/160 acuity and a visual field score of 18.6; (E) and (F) depict the right eye of a 26-year-old man with a severe ABCA4 genotype, 10/160 acuity and a visual field score of 1.1; (G) and (H) depict the right eye of a 47-year-old woman with a moderate ABCA4 genotype, 20/20 acuity and a visual field score of 8.2; (I) and (J) depict the left eye of a 15-year-old woman with a moderate ABCA4 genotype, 20/160 acuity and a visual field score of 43.2.
Figure 5.
Figure 5.
Fundus photographs and Goldman visual fields of five patients with ABCA4-associated retinal disease. The patients depicted in the upper 10 panels have acuities and visual fields that are completely predicted by the additive effects of their ABCA4 alleles. The patient depicted in (G) and (H) has better visual acuity and poorer visual fields than expected for her genotype, while the patient depicted in (I) and (J) has poorer visual acuity and better fields than expected. (A) and (B) depict the left eye of a 27-year-old woman with a mild ABCA4 genotype, 20/30 acuity and a visual field score of 37.5; (C) and (D) depict the right eye of an 24-year-old man with a moderate ABCA4 genotype, 20/160 acuity and a visual field score of 18.6; (E) and (F) depict the right eye of a 26-year-old man with a severe ABCA4 genotype, 10/160 acuity and a visual field score of 1.1; (G) and (H) depict the right eye of a 47-year-old woman with a moderate ABCA4 genotype, 20/20 acuity and a visual field score of 8.2; (I) and (J) depict the left eye of a 15-year-old woman with a moderate ABCA4 genotype, 20/160 acuity and a visual field score of 43.2.

References

    1. Shroyer N.F., Lewis R.A., Lupski J.R. Complex inheritance of ABCR mutations in Stargardt disease: linkage disequilibrium, complex alleles, and pseudodominance. Hum. Genet. 2000;106:244–248. doi:10.1007/s004390051034. - DOI - PubMed
    1. Shroyer N., Lewis R.A., Yatsenko A.N., Wensel T.G., Lupski J.R. Cosegregation and functional analysis of mutant ABCR (ABCA4) alleles in families that manifest both Stargardt disease and age-related macular degeneration. Hum. Mol. Genet. 2001;10:2671–2678. doi:10.1093/hmg/10.23.2671. - DOI - PubMed
    1. Webster A.R., Heon E., Lotery A.J., Vandenburgh K., Casavant T.L., Oh K.T., Beck G., Fishman G.A., Lam B.L., Levin A., et al. An analysis of allelic variation in the ABCA4 gene. Invest. Ophthalmol. Vis. Sci. 2001;42:1179–1189. - PubMed
    1. Maugeri A., van Driel M.A., van de Pol D.J., Klevering B.J., van Haren F.J., Tijmes N., Bergen A.A., Rohrschneider K., Blankenagel A., Pinckers A.J., et al. The 2588G–>C mutation in the ABCR gene is a mild frequent founder mutation in the Western European population and allows the classification of ABCR mutations in patients with Stargardt disease. Am. J. Hum. Genet. 1999;64:1024–1035. doi:10.1086/302323. - DOI - PMC - PubMed
    1. Allikmets R., Singh N., Sun H., Shroyer N.F., Hutchinson A., Chidambaram A., Gerrard B., Baird L., Stauffer D., Peiffer A., et al. A photoreceptor cell-specific ATP-binding transporter gene (ABCR) is mutated in recessive Stargardt macular dystrophy. Nat. Genet. 1997;15:236–246. doi:10.1038/ng0397-236. - DOI - PubMed

Publication types

Substances