. 2010 Sep 24;285(39):29941-50.
doi: 10.1074/jbc.M109.094607. Epub 2010 Jul 20.

Enhancement of procollagen biosynthesis by p180 through augmented ribosome association on the endoplasmic reticulum in response to stimulated secretion

Affiliations

Enhancement of procollagen biosynthesis by p180 through augmented ribosome association on the endoplasmic reticulum in response to stimulated secretion

Tomonori Ueno et al. J Biol Chem. .

Abstract

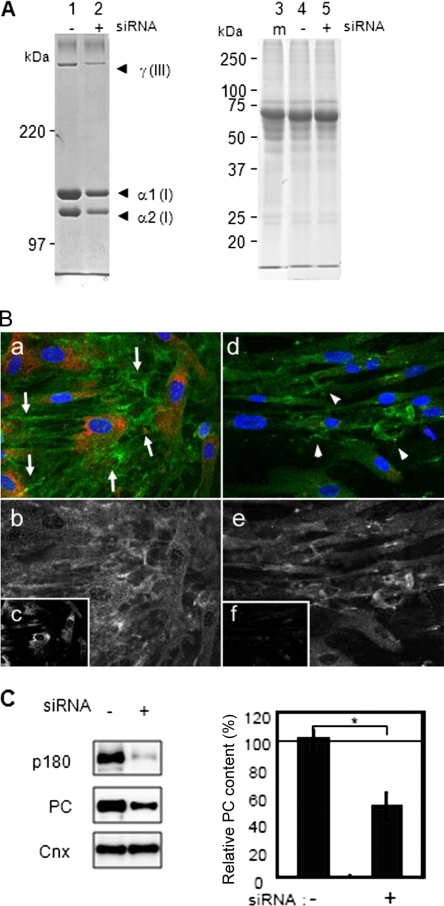
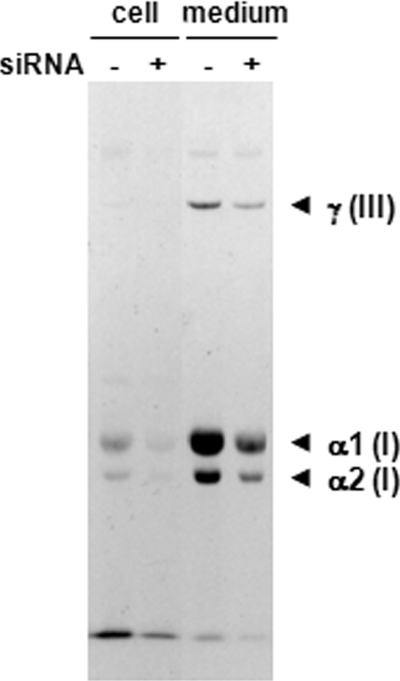
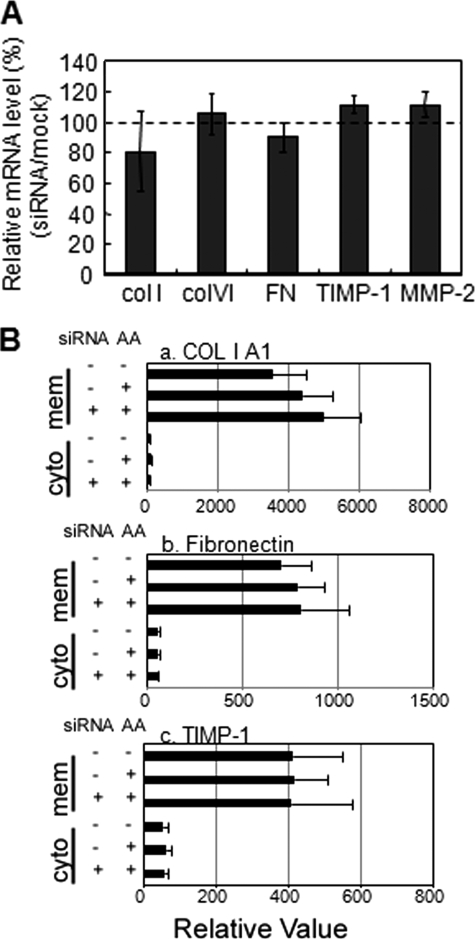
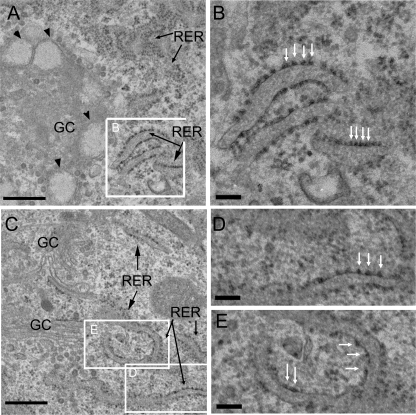
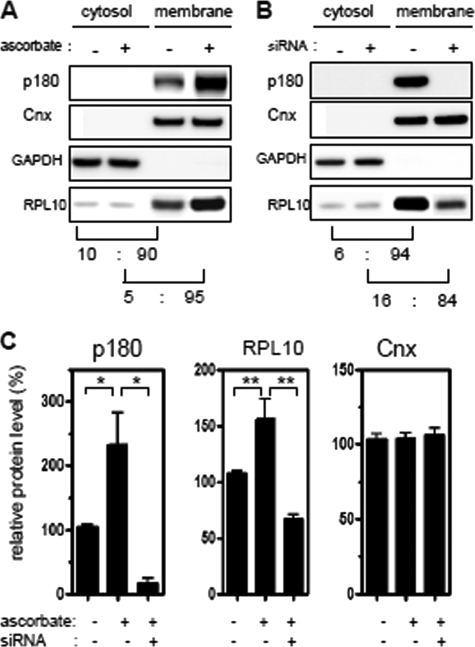
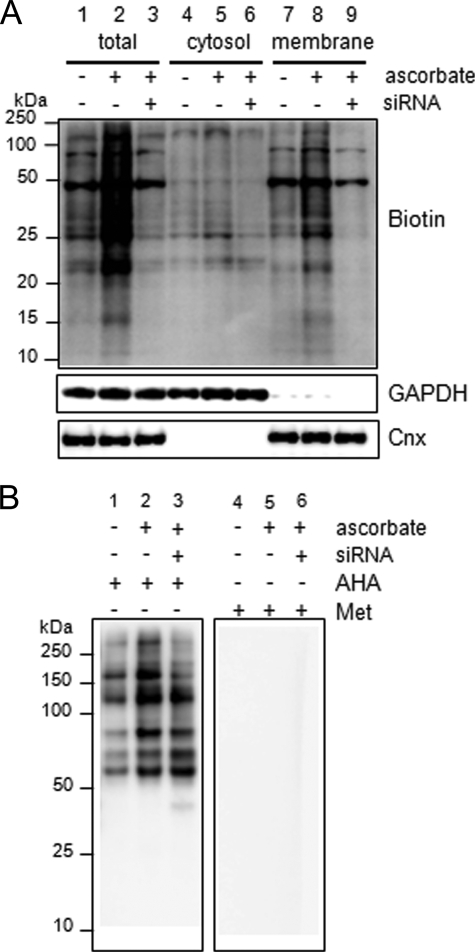
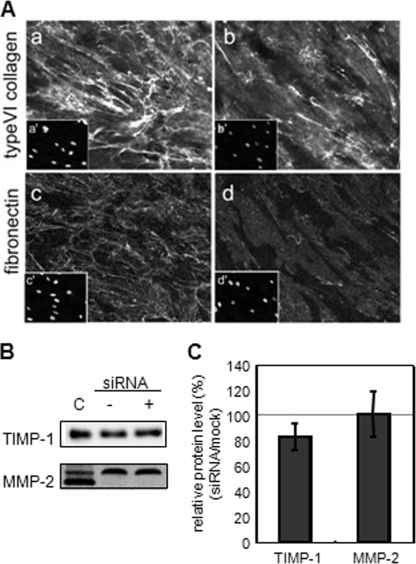
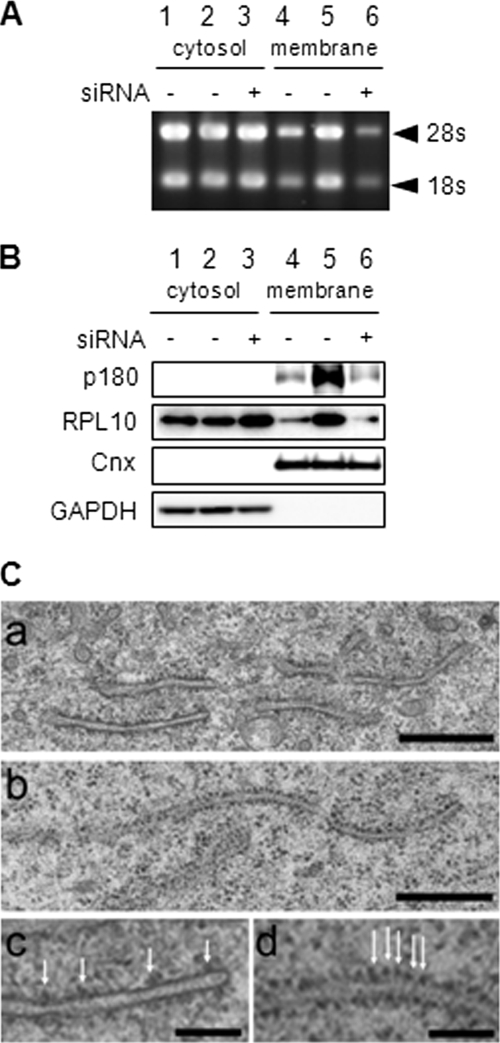
A coiled-coil microtubule-bundling protein, p180, was originally reported as a ribosome-binding protein on the rough endoplasmic reticulum (ER) and is highly expressed in secretory tissues. Recently, we reported a novel role for p180 in the trans-Golgi network (TGN) expansion following stimulated collagen secretion. Here, we show that p180 plays a key role in procollagen biosynthesis and secretion in diploid fibroblasts. Depletion of p180 caused marked reductions of secreted collagens without significant loss of the ER membrane or mRNA. Metabolic labeling experiments revealed that the procollagen biosynthetic activity was markedly affected following p180 depletion. Moreover, loss of p180 perturbs ascorbate-stimulated de novo biosynthesis mainly in the membrane fraction with a preferential secretion defect of large proteins. At the EM level, one of the most prominent morphological features of p180-depleted cells was insufficient ribosome association on the ER membranes. In contrast, the ER of control cells was studded with numerous ribosomes, which were further enhanced by ascorbate. Similarly biochemical analysis confirmed that levels of membrane-bound ribosomes were altered in a p180-dependent manner. Taken together, our data suggest that p180 plays crucial roles in enhancing collagen biosynthesis at the entry site of the secretory compartments by a novel mechanism that mainly involves facilitating ribosome association on the ER.


Figures

FIGURE 1.
FIGURE 1.
p180 depletion results in reduced levels of collagen secretion and intracellular procollagen. A, Coomassie Brilliant Blue-stained purified collagens (lanes 1 and 2) and total proteins (lanes 3–5) of the culture medium on post-transfection days 3–5 are shown. Purified collagens from the medium of control (lane 1) or p180-depleted cells (lane 2) were analyzed using a 5% gel without reduction. α1(I), type I collagen α1 chain; α2(I), type I collagen α2 chain; γ(III), type III collagen γ chain. Total protein patterns of medium from control (lane 4) or p180-depleted cells (lane 5) are indistinguishable from that of medium fraction without cell cultures (lane 3), suggesting that most of the proteins detected in the culture medium had not been secreted from the cells, but originated from the supplemented FBS. B, depletion of p180 leads to disruption of the normal fibril formation of type I collagen. Control cells (a–c) and siRNA-transfected cells (d–f) were analyzed at post-transfection day 5 by immunostaining for type I collagen (b and e) and p180 (c and f). Merged images are shown in panels a and d. Green, type I collagen; red, p180; blue, nuclei. Well organized fibrils were seen in control cells (arrows), whereas p180-depleted cells contain immature fibrils. C, at post-transfection day 5, cells were harvested and analyzed by Western blotting using monoclonal antibodies against procollagen N-propeptide (PC), p180, and calnexin (Cnx). D, the relative protein levels of intracellular procollagen were defined by densitometric analysis. The data represent the mean ± S.D. of three separate experiments, and are indicated as percentages of the control sample set at 100% (dotted line). *, p < 0.01.
FIGURE 2.
FIGURE 2.
p180 depletion causes marked reduction in newly synthesized collagens. [3H]Proline-labeled collagens were prepared from cell layers and medium of HEL cells transfected with a control siRNA (siRNA −) or p180 siRNA (siRNA +), and analyzed by SDS-PAGE using a 5% gel without reduction. A fluorographic image is shown with the expected positions for the major collagen species. Knockdown of p180 was confirmed by Western blotting analyses in a parallel experiment (data not shown).
FIGURE 3.
FIGURE 3.
Relative mRNA levels of various secretory proteins after p180 depletion. mRNA levels were estimated by real time PCR following treatment with a p180-specific siRNA (p180-1) (A). Relative mRNA levels of total cells. Data were normalized by the amounts of MT-ATP6 mRNA. The data represent the mean ± S.D. of three separate experiments, and are indicated as percentages of the corresponding levels in control cells set at 100% (dotted line). Data for type I collagen (col I), type VI collagen (col VI), fibronectin (FN), TIMP-1, and MMP-2 are shown. B, cytosolic and membrane fractions of HEL cells treated by ascorbate and/or siRNA (p180-1) were prepared by sequential digitonin treatment. Relative mRNA levels of cytosolic or membrane fractions are shown for type I collagen (COL IA1), fibronectin, and TIMP-1. Cyto, cytosol; mem, membrane.
FIGURE 4.
FIGURE 4.
Ultrastructures of the rough ER in control and p180-depleted cells. Transmission EM images of control (A and B) and p180-depleted (C–E) HEL cells are shown. Densely studded ribosomes on the ER are visible in ascorbate-stimulated HEL cells (arrows in B), whereas p180 depletion causes reduced densities of ribosomes on the membranes (arrows in D and E). In addition, large distensions are prominent in the Golgi complex of control cells (small arrowheads), whereas normally stacked Golgi cisternae without distensions are observed in p180-depleted cells (C). RER, rough endoplasmic reticulum; GC, Golgi complex. Bars: A and C, 500 nm: B, D, and E, 100 nm. Higher magnification images for the area surrounded by white rectangles are shown in B, D, and E. Ribosomes attached on the membrane edges are shown by white arrows in the cross-section.
FIGURE 5.
FIGURE 5.
The amounts of membrane-bound RPL10 are closely related to the expression levels of p180. Marker proteins were analyzed by immunoblotting in cytosolic and membrane fractions of HEL cells prepared by sequential digitonin treatment. Effects of (A) ascorbate stimulation, or (B) siRNA transfection in the presence of ascorbate are shown, respectively. Relative protein levels of RPL10 were quantified by densitometric scanning, and ratios between cytosolic and membrane fractions are shown below the corresponding bands. C, the relative marker protein levels in the membrane-bound fractions were determined by densitometric scanning. The data represent the mean ± S.E. of four separate experiments each performed in double or triplicate, and are indicated as percentages of ascorbate-untreated control cells set at 100%. *, p < 0.05; **, p < 0.01. Cnx, calnexin.
FIGURE 6.
FIGURE 6.
p180 depletion perturbs ascorbate-stimulated de novo biosynthesis on the ER. A, activity of de novo biosynthesis was estimated by the non-radioisotopic labeling system with AHA in HEL cells. Cells were cultured in the presence or absence of ascorbate and treated with control or p180-specific siRNA. After incubation with AHA, sequential digitonin extraction was carried out to obtain cytosolic and membrane fractions. AHA-incorporated proteins were labeled with biotin-alkyne by click chemistry and blotted by anti-biotin antibody. The expected enrichment of membrane and cytosol was verified by blotting analysis of marker proteins using antibody against GAPDH and calnexin (Cnx). Lanes 1–3, total cell lysates; lanes 4–6, cytosol; lanes 7–9, membrane fraction. B, general secretory activity was estimated by analyzing AHA-tagged proteins secreted into culture medium. Cells treated with control or p180-specific siRNA were labeled with AHA (lanes 1–3) or l-methionine (lanes 4–6) for 4 h. After washout and replacement by ordinary medium, cells were cultured for 18 h. Culture medium was collected, followed by analysis for AHA-incorporated proteins as in A. No specific signal was detected in methionine-labeled cultures (lanes 4–6), confirming specificity of the labeling procedure.
FIGURE 7.
FIGURE 7.
Suppression of p180 affects the secretion of other ECM proteins. A, at post-transfection day 5, control cells (a and c) and p180-depleted cells (b and d) were subjected to immunostaining with antibodies against type VI collagen (a and b) and fibronectin (c and d). Depletion of p180 causes apparent impairment of the ECM network formation. Nuclei were stained with TOPRO3 (a′d′). B, the secreted TIMP-1 protein levels and MMP-2 activities were examined by immunoblotting and real time zymography, respectively. Cultured medium from control and p180-depleted cells were collected on post-transfection days 2–5 and subjected to each analysis. Recombinant human TIMP-1 and human MMP-2 proenzyme from rheumatoid synovial fibroblast were used as control (lane c), respectively. Upper and lower bands in lanes for control MMP-2 are latent and intermediate forms of the proenzyme, respectively. C, the individual protein levels were quantified by densitometric scanning. The data represent the mean ± S.D. of three separate experiments, and the results are expressed as percentages of the levels in control cells set at 100% (dotted line).
FIGURE 8.
FIGURE 8.
Manipulation of p180 expression levels affects the amount of membrane-associated ribosomes in HeLa transfectants. The amounts of ER-associated and cytosolic ribosomes were compared among stable HeLa transfectants overexpressing p180 (HeLa/p180) (lanes 2, 3, 5, and 6) and control cells (HeLa/puro) (lanes 1 and 4). Membrane and cytosolic fractions were prepared by sequential detergent extraction from p180-depleted (lanes 3 and 6) and untreated (lanes 2 and 5) HeLa/p180 cells and HeLa/puro cells (lanes 1 and 4), as described in the legend for Fig. 5. A, ribosomal RNAs were analyzed by agarose gel electrophoresis and stained with ethidium bromide. B, membrane and cytosolic fractions were analyzed by immunoblotting. C, EM images of HeLa/puro (a and c) and HeLa/p180 (b and d) cells. Ribosomes studded on the membranes are shown by arrows. Bars: a and b, 500 nm; c and d, 100 nm. Cnx, calnexin.

Similar articles

Cited by

References

    1. Baumann O., Walz B. (2001) Int. Rev. Cytol. 205, 149–214 - PubMed
    1. Shibata Y., Voeltz G. K., Rapoport T. A. (2006) Cell 126, 435–439 - PubMed
    1. Canty E. G., Kadler K. E. (2005) J. Cell. Sci. 118, 1341–1353 - PubMed
    1. Myllyharju J. (2003) Matrix Biol. 22, 15–24 - PubMed
    1. Fromme J. C., Schekman R. (2005) Curr. Opin. Cell. Biol. 17, 345–352 - PubMed

MeSH terms