

Hyperglycemia and advanced glycosylation end products suppress adipocyte apoE expression: implications for adipocyte triglyceride metabolism
- PMID: 20647555
- PMCID: PMC2957866
- DOI: 10.1152/ajpendo.00273.2010
Hyperglycemia and advanced glycosylation end products suppress adipocyte apoE expression: implications for adipocyte triglyceride metabolism
Abstract
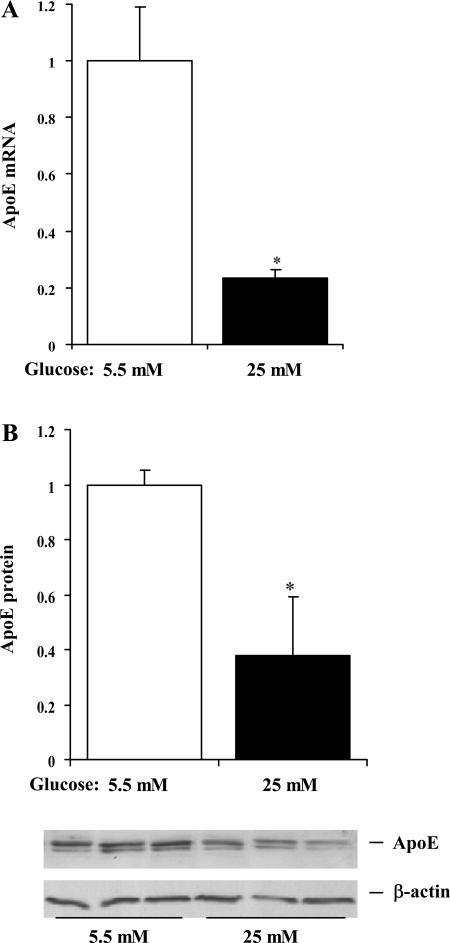
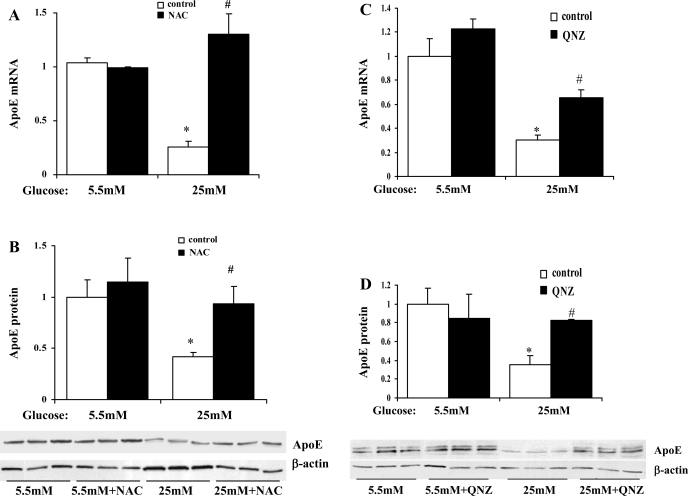
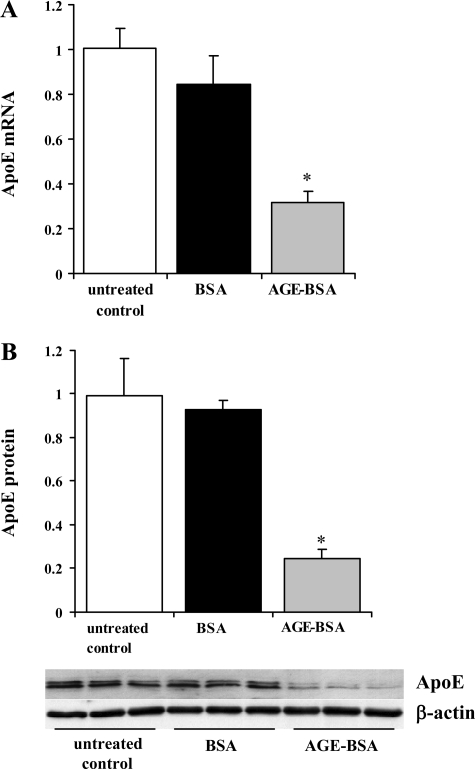
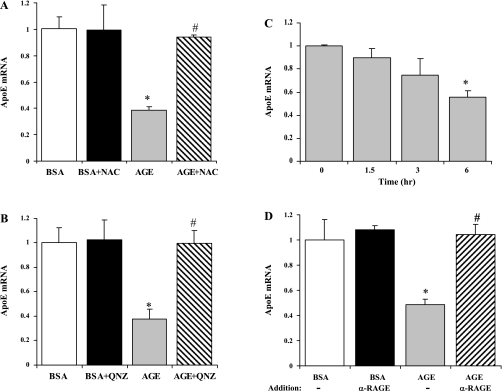
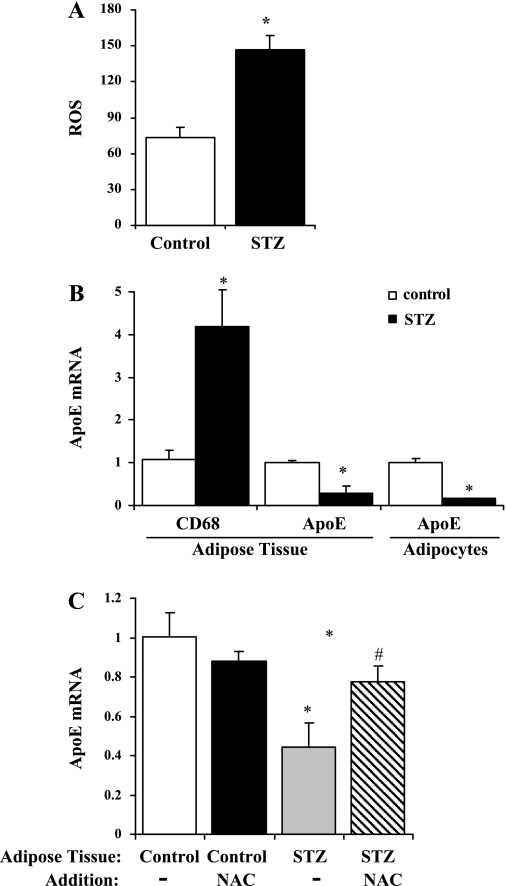
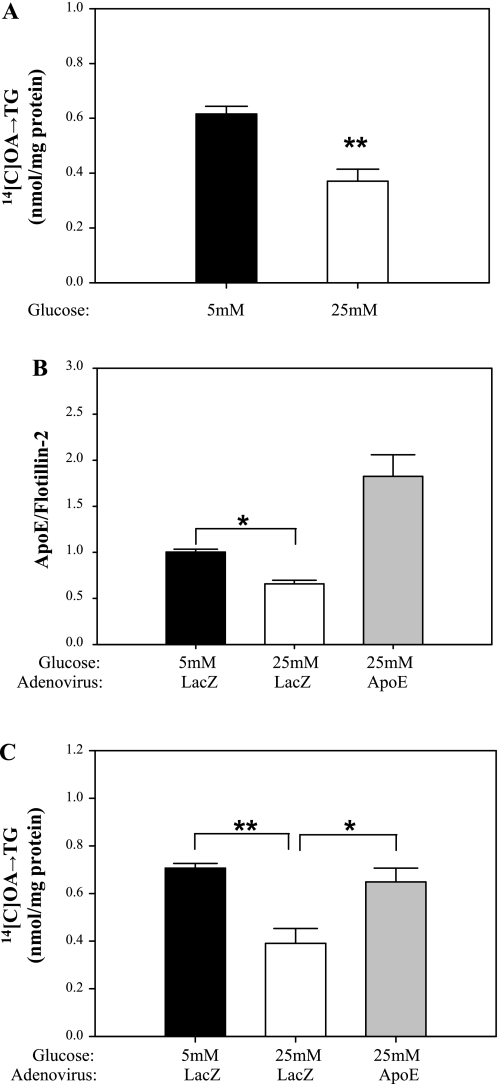
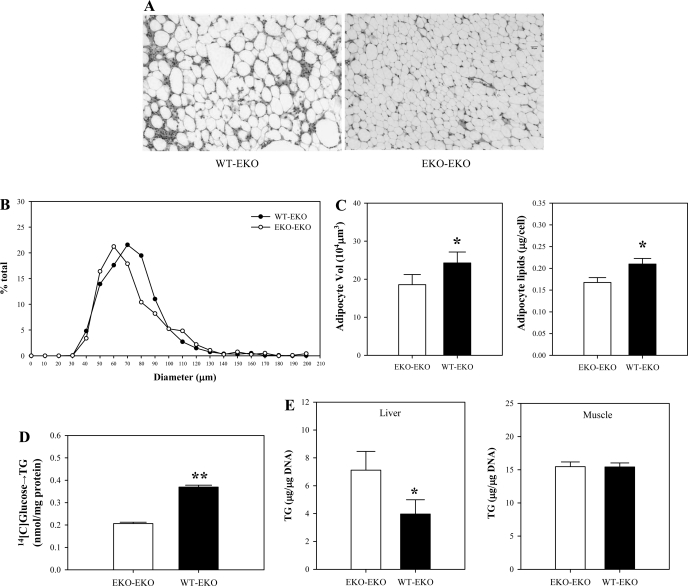
Endogenous adipocyte apolipoprotein E (apoE) plays an important role in adipocyte lipoprotein metabolism and lipid flux. A potential role for hyperglycemia in regulating adipocyte apoE expression and triglyceride metabolism was examined. Exposure of adipocytes to high glucose or advanced glycosylation end product-BSA significantly suppressed apoE mRNA and protein levels. This suppression was significantly attenuated by antioxidants or inhibitors of the NF-κB transcription pathway. Hyperglycemia in vivo led to adipose tissue oxidant stress and significant reduction in adipose tissue and adipocyte apoE mRNA level. Incubation with antioxidant in organ culture completely reversed this suppression. Hyperglycemia also reduced adipocyte triglyceride synthesis, and this could be completely reversed by adenoviral-mediated increases in apoE. To more specifically evaluate an in vivo role for adipocyte apoE expression on organismal triglyceride distribution in vivo, WT or apoE knockout (EKO) adipose tissue was transplanted in EKO recipient mice. After 12 wk, WT adipocytes transplanted in EKO mice accumulated more triglyceride compared with transplanted EKO adipocytes. In addition, EKO recipients of WT adipose tissue had reduced hepatic triglyceride content compared with EKO recipients transplanted with EKO adipose tissue. Our results demonstrate that hyperglycemia and advanced glycosylation end products suppress the expression of adipocyte apoE in vitro and in vivo and thereby reduce adipocyte triglyceride synthesis. In vivo results using adipose tissue transplantation suggest that reduction of adipocyte apoE, and subsequent reduction of adipocyte triglyceride accumulation, could influence lipid accumulation in nonadipose tissue.
Figures
Similar articles
-
Role of adipocyte-derived apoE in modulating adipocyte size, lipid metabolism, and gene expression in vivo.Am J Physiol Endocrinol Metab. 2009 May;296(5):E1110-9. doi: 10.1152/ajpendo.90964.2008. Epub 2009 Feb 17. Am J Physiol Endocrinol Metab. 2009. PMID: 19223650 Free PMC article.
-
Mechanism for endogenously expressed ApoE modulation of adipocyte very low density lipoprotein metabolism: role in endocytic and lipase-mediated metabolic pathways.J Biol Chem. 2009 Nov 13;284(46):31512-22. doi: 10.1074/jbc.M109.004754. Epub 2009 Sep 18. J Biol Chem. 2009. PMID: 19767394 Free PMC article.
-
Oxidative stress regulates adipocyte apolipoprotein e and suppresses its expression in obesity.Diabetes. 2008 Nov;57(11):2992-8. doi: 10.2337/db08-0592. Epub 2008 Aug 4. Diabetes. 2008. PMID: 18678613 Free PMC article.
-
Apolipoprotein E synthesized by adipocyte and apolipoprotein E carried on lipoproteins modulate adipocyte triglyceride content.Lipids Health Dis. 2014 Aug 23;13:136. doi: 10.1186/1476-511X-13-136. Lipids Health Dis. 2014. PMID: 25148848 Free PMC article. Review.
-
Insights into the roles of Apolipoprotein E in adipocyte biology and obesity.Int J Obes (Lond). 2024 Sep;48(9):1205-1215. doi: 10.1038/s41366-024-01549-9. Epub 2024 Jun 5. Int J Obes (Lond). 2024. PMID: 38839985 Review.
Cited by
-
Mechanism and implications of advanced glycation end products (AGE) and its receptor RAGE axis as crucial mediators linking inflammation and obesity.Mol Biol Rep. 2025 Jun 5;52(1):556. doi: 10.1007/s11033-025-10632-x. Mol Biol Rep. 2025. PMID: 40474023 Review.
-
Muscle and Joint Factors Associated With Forefoot Deformity in the Diabetic Neuropathic Foot.Foot Ankle Int. 2016 May;37(5):514-21. doi: 10.1177/1071100715621544. Epub 2015 Dec 14. Foot Ankle Int. 2016. PMID: 26666675 Free PMC article.
-
Expression of the human apoE2 isoform in adipocytes: altered cellular processing and impaired adipocyte lipogenesis.J Lipid Res. 2011 Sep;52(9):1733-41. doi: 10.1194/jlr.M017160. Epub 2011 Jul 8. J Lipid Res. 2011. PMID: 21743035 Free PMC article.
-
Receptor for the Advanced Glycation End Products (RAGE) Pathway in Adipose Tissue Metabolism.Int J Mol Sci. 2023 Jul 1;24(13):10982. doi: 10.3390/ijms241310982. Int J Mol Sci. 2023. PMID: 37446161 Free PMC article. Review.
-
Selective suppression of adipose tissue apoE expression impacts systemic metabolic phenotype and adipose tissue inflammation.J Lipid Res. 2015 Feb;56(2):215-26. doi: 10.1194/jlr.M050567. Epub 2014 Nov 24. J Lipid Res. 2015. PMID: 25421060 Free PMC article.
References
-
- Basu SK, Ho YK, Brown MS, Bilheimer DW, Anderson RG, Goldstein JL. Biochemical and genetic studies of the apoprotein E secreted by mouse macrophages and human monocytes. J Biol Chem 257: 9788– 9795, 1982 - PubMed
-
- Han CY, Kargi AY, Omer M, Chan CK, Wabitsch M, O'Brien KD, Wight TN, Chait A. Differential effect of saturated and unsaturated free fatty acids on the generation of monocyte adhesion and chemotactic factors by adipocytes: dissociation of adipocyte hypertrophy from inflammation. Diabetes 59: 386– 396, 2010 - PMC - PubMed
Publication types
MeSH terms
Substances
Grants and funding
LinkOut - more resources
Full Text Sources
Medical
Miscellaneous