. 2010 Oct 14;116(15):e41-55.
doi: 10.1182/blood-2010-02-268466. Epub 2010 Jul 20.

Hematopoiesis in 3 dimensions: human and murine bone marrow architecture visualized by confocal microscopy

Affiliations

Hematopoiesis in 3 dimensions: human and murine bone marrow architecture visualized by confocal microscopy

Tomoiku Takaku et al. Blood. .

Abstract

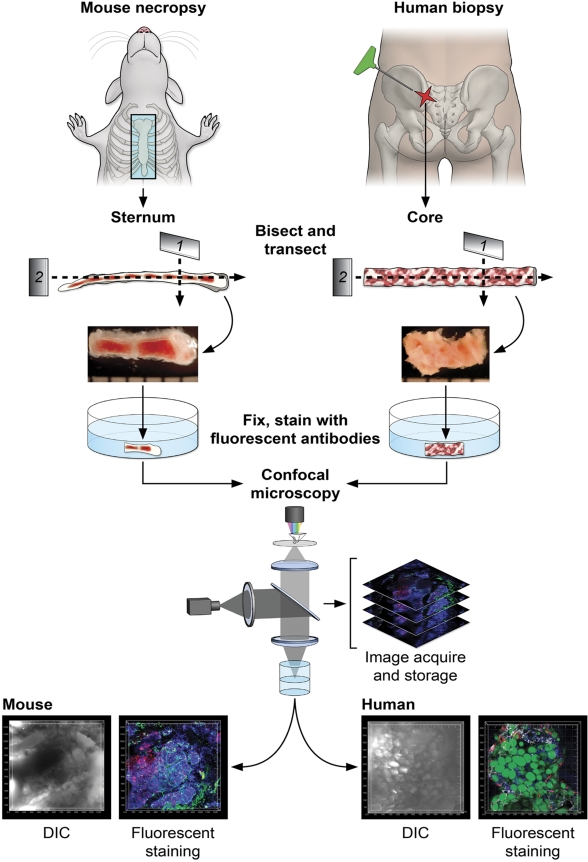
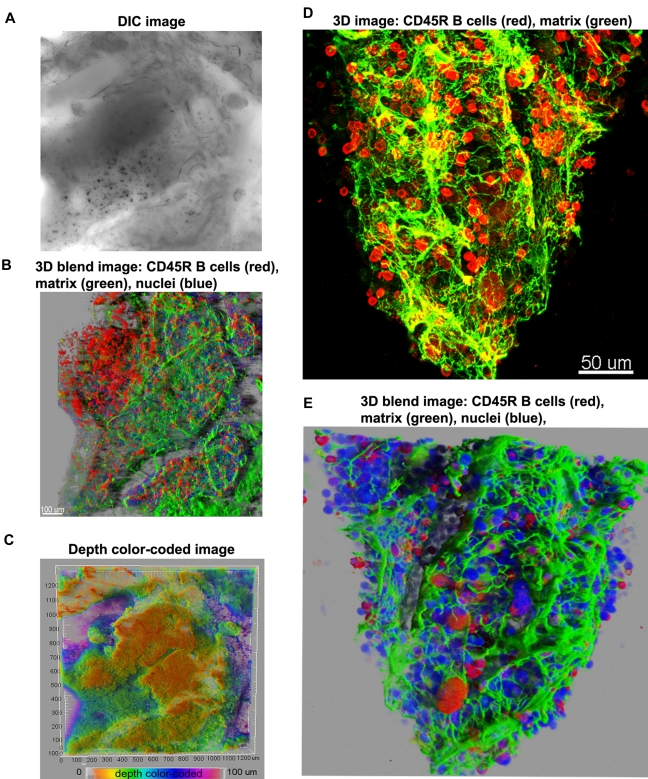
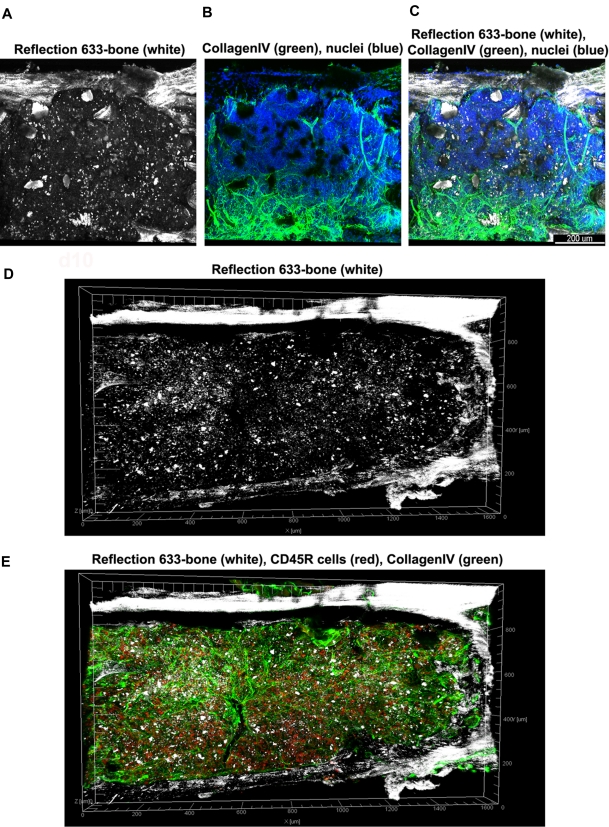
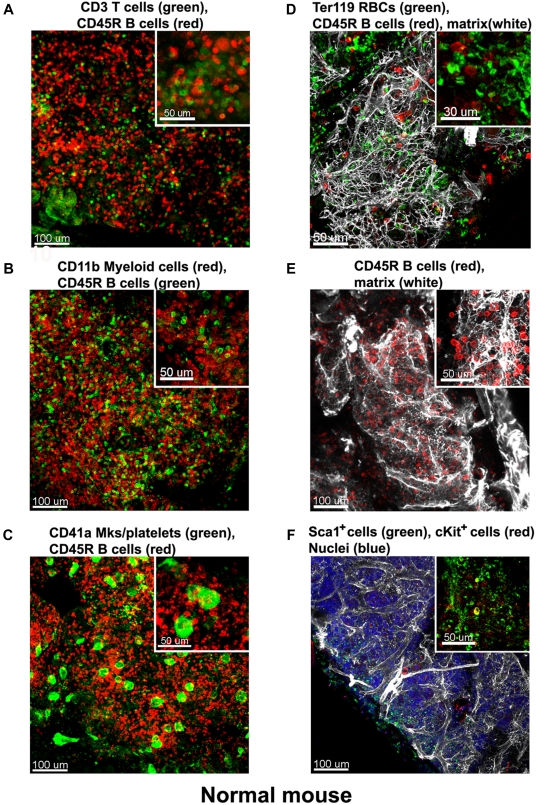
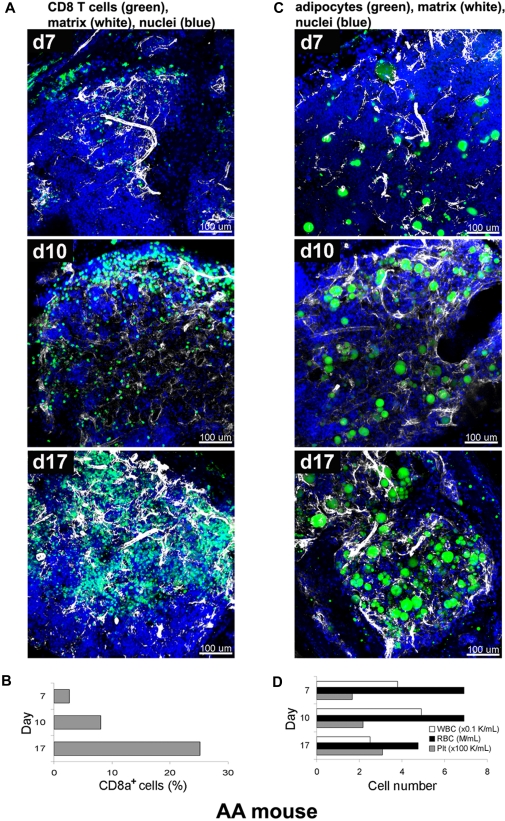
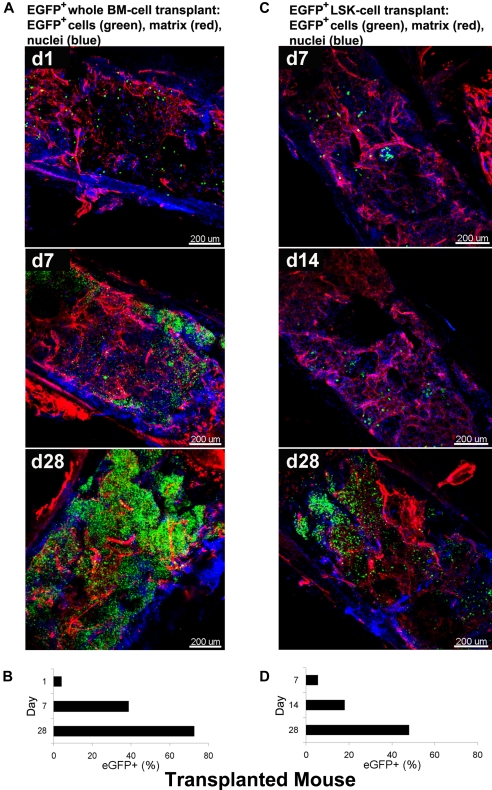
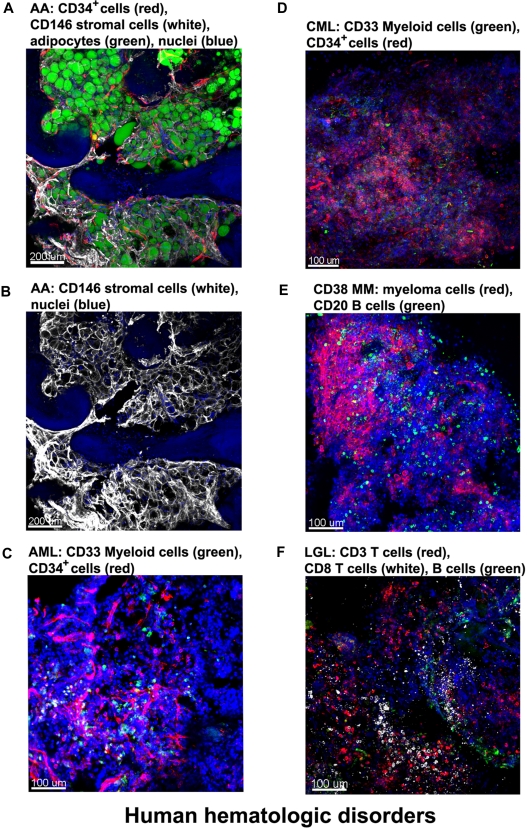
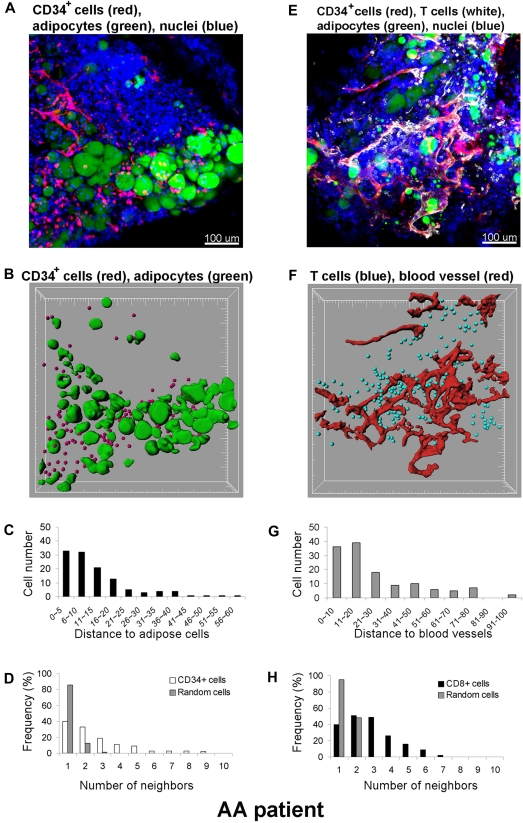
In many animals, blood cell production occurs in the bone marrow. Hematopoiesis is complex, requiring self-renewing and pluripotent stem cells, differentiated progenitor and precursor cells, and supportive stroma, adipose tissue, vascular structures, and extracellular matrix. Although imaging is a vital tool in hematology research, the 3-dimensional architecture of the bone marrow tissue in situ remains largely uncharacterized. The major hindrance to imaging the intact marrow is the surrounding bone structures are almost impossible to cut/image through. We have overcome these obstacles and describe a method whereby whole-mounts of bone marrow tissue were immunostained and imaged in 3 dimensions by confocal fluorescence and reflection microscopy. We have successfully mapped by multicolor immunofluorescence the localization pattern of as many as 4 cell features simultaneously over large tiled views and to depths of approximately 150 μm. Three-dimensional images can be assessed qualitatively and quantitatively to appreciate the distribution of cell types and their interrelationships, with minimal perturbations of the tissue. We demonstrate its application to normal mouse and human marrow, to murine models of marrow failure, and to patients with aplastic anemia, myeloid, and lymphoid cell malignancies. The technique should be generally adaptable for basic laboratory investigation and for clinical diagnosis of hematologic diseases.


Figures

Figure 1
Figure 1
Diagrams of the protocol of BM sample preparation and confocal microscopy. For mouse BM, sternums were bisected sagittally into 2 to 3 segments. For human BM, core biopsies were bisected into segments (2-4 mm). Segments were further transected, fixed (except for EGFP-expressing tissues), and fluorescently stained as whole-mounts. Fluorescently labeled BM tissues were subjected to confocal microscopy, and series of images were used to reconstruct the 3D architecture of BM (related images in supplemental Video 1).
Figure 2
Figure 2
Overview of 3D reconstructions of mouse BM architecture. Using DIC (A), mouse marrow tissue within the bone fossae of the sternum was located and examined; corresponding z-series of immunofluorescence images (B) (approximate volume of 600 × 600 × 150 μm3) were reconstructed. (B) A 3D blend rendering showing large islands of CD45R+ cells (B lymphocytes in red), surrounded by extracellular matrix (perlecan in green), and DAPI (blue) identifying all nucleated cells. (C) A depth color coded 3D image where the depth was pseudocolored (0 μm = orange and 100 = magenta) of the same field as in panels A and B. The close-up 3D images either as maximum intensity (D) or as blend projection (E) display an intricate network of extracellular matrix (perlecan in green) outlining blood vessels and the nests of CD45R+ cells (B lymphocytes in red). DAPI (blue) identifies all nucleated cells (E). Related images appear in supplemental Video 2.
Figure 3
Figure 3
Tiled views of confocal reflection and fluorescence of the normal mouse BM. Confocal reflection 3D image (A) displays the bone structure (white): the outer shell as well as several internal bone spikes and trabecullae can be identified (using a 633-nm laser light reflected on the imaging detector). In the corresponding confocal fluorescence 3D image (B), cells (DAPI, blue) and vascular structures and extracellular matrix (collagen type IV, green) are shown; several tissue discontinuities appear like “holes.” The merged image (C) clearly demonstrates the overlap of the bone structures over these discontinuities. Tiled z-stacks of images were collected over large volume (2.6 × 1.2 mm × 150 μm) of the mouse BM tissue and computationally stitched. A large tile over entire bone fossae is depicted in panels (D) (bone reflection) and E (merged with the fluorescence of CD34 in red, collagen type IV in green, DAPI in blue) respectively, to illustrate very good tissue preservation. Related images appear in supplemental Video 3).
Figure 4
Figure 4
Immunostaining of the normal mouse BM. Mouse BM whole-mount specimens were fluorescently double labeled with various combinations of lineage-specific antibodies for T and B cells, myeloid cells, megakaryocytes/platelets, and erythrocytes. In addition extracellular matrix was also visualized by perlecan staining. Each inset shows a higher magnification of a 100-μm2 area of the corresponding confocal image, these depict a heterogeneous mixture of the main lineage cells: (A) CD3e+ T cells (green) appear scattered and much less numerous than CD45R+ B cells (red). (B) In contrast, CD11b+myeloid cells (red) are more abundant than B cells (green). (C) Megakaryocytes (large cells) and small platelets, both CD41+ (green), appear scattered evenly in the intertrabecullar space. (D) TER119+erythroid cells (green) are numerous and tend to form clusters. (E) CD45R+ B cells (red) are abundant and appear in close proximity to the extracellular matrix network (perlecan, white). (F) Hematopoietic stem and progenitor cells identified as double-labeled Sca1+ and cKit+ are scarce. A complex network of extracellular matrix surrounds and supports the cellular compartments (white in panels D-E). Scale bars are in micrometers. All results are representative of at least 3 independent experiments. Related images appear in supplemental Videos 4 and 5.
Figure 5
Figure 5
Altered BM tissue of AA mouse model. AA mice were generated by infusion of B6-LN cells into sublethally irradiated C.B10 mice. BM whole-mount specimens of recipients were fluorescently stained using antibodies to CD8+ T cells (green), perlecan (white), and DAPI (nuclei) without or with BODIPY 493/503 (adipocytes), and subjected to examination on days 7, 10, and 17 by confocal microscopy (A,C). (A) After initial hypocellularity (day 7), a massive radial expansion of CD8+ T cells (green) was observed at day 10 and day 17 in parallel with extracellular matrix remodeling (white). Quantitative analysis of CD8+ cells in the BM samples was performed by flow cytometry (B). Concomitant staining of adipocytes (BODIPY in green), (C) revealed increasing number of adipocytes over time in parallel with extracellular matrix remodeling (white). (D) The cell numbers of WBCs, RBCs, and platelets in peripheral blood on days 7, 10, and 17 were enumerated by an automated cell counter. Scale bars are in micrometers. Related images appear in supplemental Video 6.
Figure 6
Figure 6
Dynamic analysis of infiltration/expansion of EGFP cells in transplanted mice. Total BM or LSK cells were obtained from B6/EGFP mice expressing EGFP in all tissues and infused into B6 mice irradiated lethally, generating B6/tBM/EGFP or B6/LSK/EGFP mice. BM whole-mount specimens were examined at different time points by confocal microscopy (A,C) and isolated EGFP + hematopoietic cells were quantified by flow cytometry (B,D). (A) BM images of the B6/BM/EGFP mice on days 1, 7, and 28 illustrate: on day 1, massive destruction of extracellular matrix (red) and very few EGFP + cells (green) close to the bone edge; on day 7, remodeling of the extracellular matrix and increased number of EGFP+ cells, in islands beneath the bone edge; and by day 28, a complex network of extracellular matrix (red) and numerous EGFP+ cells evenly distributed. (B) Frequencies of EGFP-expressing cells in BM cells of the B6/BM/EGFP mice on days 1, 7, and 28 by flow cytometry. (C) BM images of the B6/LSK/EGFP mice on days 7, 14, and 28: at day 7, scarce clusters of EGFP+ cells appeared centrally located; at day 14, several clusters of EGFP+ cells were localized both centrally and peripherally, toward the bone edge; and at day 28, islands of EGFP+ cells were visible in the center of the tissue. (D) Frequencies of EGFP-expressing cells in BM cells of the B6/LSK/EGFP mice on days 7, 14, and 28, measured by flow cytometry. Nuclei were stained with DAPI. Scale bars are in micrometers. Related images appear in supplemental Video 7.
Figure 7
Figure 7
Altered BM architecture in tissues from patients with hematologic diseases. BM whole-mount specimens from patients with hematopoietic disorders were fluorescently stained with cell lineage–specific antibodies and DAPI (nuclei). (A) SAA: most of the hematopoietic space is occupied by adipocytes (green) closely surrounded by almost overlapping vascular (CD34, red) and stromal (CD146, white) network. (B) Same image as in panel A but only the CD146+ staining to clearly display the stromal cell meshwork. (C) AML: both normal and malignant myeloid cells, recognized by anti-CD33 Ab, appear in clusters (green); in addition, an increased number of CD34+ cells (red) appear in close proximity to the endothelial matrix (red). (D) CML-blast crisis: CD34+ leukemic blasts (red) occupy the BM. (E) Multiple myeloma: massive numbers of irregularly shaped malignant CD38+ cells (red), forming a large nodule. (F) T large granular lymphocyte leukemia: sparsely distributed CD8+ cells (white), along with CD3+ cells (red) and sporadic CD20+ B cells (green). Scale bars are in micrometers. Related images appear in supplemental Videos 8 and 9.
Figure 8
Figure 8
Quantitative analysis of cell distributions in 3 dimensions. A BM specimen from a patient with SAA was fluorescently labeled with antibodies to CD34, CD8, BODIPY 493/503 (adipocytes), and DAPI (nuclei) (A,E). Original confocal images are presented in top panels (A) CD34+ cells (red)/adipocytes (green) and (E) CD8+ cells (white)/blood vessels (red). Bottom panels display segmented images of (B) CD34+ cells (red)/adipocytes (green) and (F) CD8+ cells (blue)/blood vessels (red), computationally extracted from the original fluorescence images, to measure the distance to adipose cells (C) and blood vessels (G), respectively. Clustering of CD34+ cells (D) and of CD8+ cells (H) was analyzed by comparing experimental data (white columns in panel D) and (black columns in panel H) with a Monte Carlo simulation (hatched columns in panels D and H) of randomly distributed cells of same density in a similar volume. Representative images and results from one patient are presented. The analysis was repeated independently 2 to 4 times for 4 different specimens.

Similar articles

Cited by

References

    1. Choi JW, Pai SH, Choe HW. Significance of the ratio of reticulocyte subpopulations in bone marrow and peripheral blood from patients with myelodysplastic syndromes. Ann Hematol. 2003;82(4):259–261. - PubMed
    1. Abboud CN, Lichtman MA. Structure of the marrow and the hematopoietic microenvironment. In: Lichtman M, Beutler E, Kaushansky K, Kipps T, Seligsohn U, Prchal J, editors. Williams Hematology. 7th ed. New York: McGraw-Hill; 2006. pp. 35–72.
    1. Dao M, Verfaillie CM. Bone marrow microenvironment. In: Hoffman R, Benz EJ Jr, Shattil SJ, Furie B, Cohen HJ, Silberstein LE, editors. Hematology: Basic Principles and Practice. 5th ed. New York: Churchill Livingstone; 2005. pp. 215–231.
    1. Lanotte M, Allen TD, Dexter TM. Histochemical and ultrastructural characteristics of a cell line from human bone-marrow stroma. J Cell Sci. 1981;50:281–297. - PubMed
    1. Adams GB, Scadden DT. The hematopoietic stem cell in its place. Nature Immunol. 2006;7(4):333–337. - PubMed

Publication types

Substances