

Reactive oxygen species control senescence-associated matrix metalloproteinase-1 through c-Jun-N-terminal kinase
- PMID: 20648623
- PMCID: PMC2913426
- DOI: 10.1002/jcp.22193
Reactive oxygen species control senescence-associated matrix metalloproteinase-1 through c-Jun-N-terminal kinase
Abstract
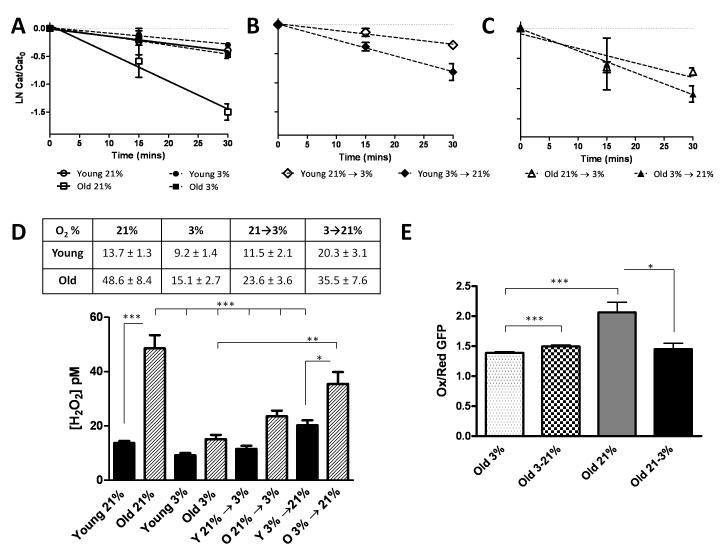
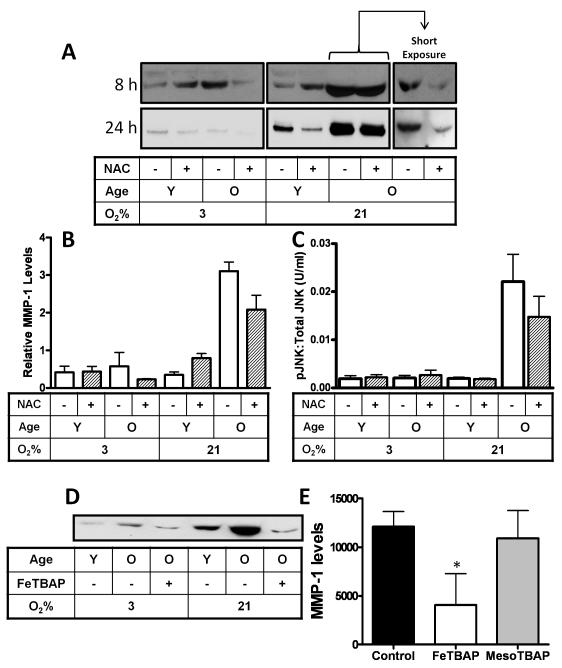
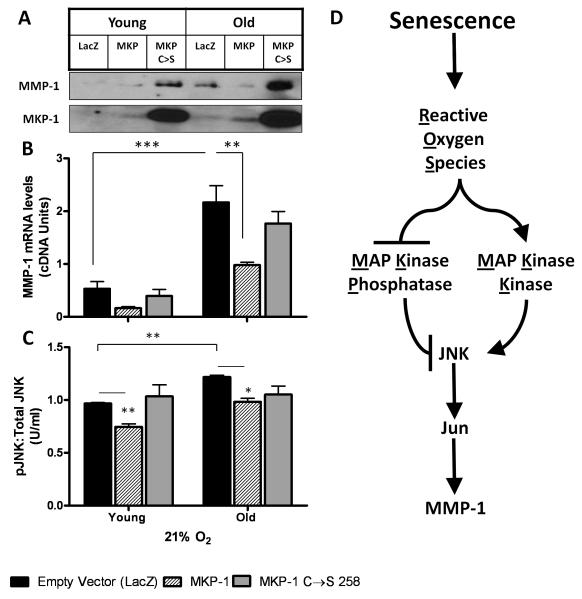
The lifetime exposure of organisms to oxidative stress influences many aging processes which involve the turnover of the extracellular matrix. In this study, we identify the redox-responsive molecular signals that drive senescence-associated (SA) matrix metalloproteinase-1 (MMP-1) expression. Precise biochemical monitoring revealed that senescent fibroblasts increase steady-state (H(2)O(2)) 3.5-fold (13.7-48.6 pM) relative to young cells. Restricting H(2)O(2) production through low O(2) exposure or by antioxidant treatments prevented SA increases in MMP-1 expression. The H(2)O(2)-dependent control of SA MMP-1 is attributed to sustained JNK activation and c-jun recruitment to the MMP-1 promoter. SA JNK activation corresponds to increases and decreases in the levels of its activating kinase (MKK-4) and inhibitory phosphatase (MKP-1), respectively. Enforced MKP-1 expression negates SA increases in JNK phosphorylation and MMP-1 production. Overall, these studies define redox-sensitive signaling networks regulating SA MMP-1 expression and link the free radical theory of aging to initiation of aberrant matrix turnover.
(c) 2010 Wiley-Liss, Inc.
Figures


Similar articles
-
Redox-sensitive gene-regulatory events controlling aberrant matrix metalloproteinase-1 expression.Free Radic Biol Med. 2014 Sep;74:99-107. doi: 10.1016/j.freeradbiomed.2014.06.017. Epub 2014 Jun 25. Free Radic Biol Med. 2014. PMID: 24973648 Free PMC article.
-
Replicative senescence of human fibroblasts: the role of Ras-dependent signaling and oxidative stress.Exp Gerontol. 2002 Oct-Nov;37(10-11):1165-74. doi: 10.1016/s0531-5565(02)00136-5. Exp Gerontol. 2002. PMID: 12470828
-
Lipoteichoic acid isolated from Lactobacillus plantarum down-regulates UV-induced MMP-1 expression and up-regulates type I procollagen through the inhibition of reactive oxygen species generation.Mol Immunol. 2015 Oct;67(2 Pt B):248-55. doi: 10.1016/j.molimm.2015.05.019. Epub 2015 Jun 6. Mol Immunol. 2015. PMID: 26059754
-
Redox-control of matrix metalloproteinase-1: a critical link between free radicals, matrix remodeling and degenerative disease.Respir Physiol Neurobiol. 2010 Dec 31;174(3):299-306. doi: 10.1016/j.resp.2010.08.019. Epub 2010 Sep 8. Respir Physiol Neurobiol. 2010. PMID: 20804863 Free PMC article. Review.
-
Reactive oxygen species in the activation of MAP kinases.Methods Enzymol. 2013;528:27-48. doi: 10.1016/B978-0-12-405881-1.00002-1. Methods Enzymol. 2013. PMID: 23849857 Review.
Cited by
-
Oxidants and antioxidants: friends or foes?Oxid Antioxid Med Sci. 2012;1(1):1-4. doi: 10.5455/oams.080612.ed.001. Oxid Antioxid Med Sci. 2012. PMID: 25960927 Free PMC article. No abstract available.
-
Enzyme-Treated Caviar Prevents UVB Irradiation-Induced Skin Photoaging.Mar Drugs. 2022 Oct 30;20(11):685. doi: 10.3390/md20110685. Mar Drugs. 2022. PMID: 36355008 Free PMC article.
-
Cytotoxicity Mechanisms of Blue-Light-Activated Curcumin in T98G Cell Line: Inducing Apoptosis through ROS-Dependent Downregulation of MMP Pathways.Int J Mol Sci. 2023 Feb 14;24(4):3842. doi: 10.3390/ijms24043842. Int J Mol Sci. 2023. PMID: 36835252 Free PMC article.
-
Oxidant exposure induces cysteine-rich protein 61 (CCN1) via c-Jun/AP-1 to reduce collagen expression in human dermal fibroblasts.PLoS One. 2014 Dec 23;9(12):e115402. doi: 10.1371/journal.pone.0115402. eCollection 2014. PLoS One. 2014. PMID: 25536346 Free PMC article.
-
Phylloquinone improves endothelial function, inhibits cellular senescence, and vascular inflammation.Geroscience. 2024 Oct;46(5):4909-4935. doi: 10.1007/s11357-024-01225-w. Epub 2024 Jul 9. Geroscience. 2024. PMID: 38980631 Free PMC article.
References
-
- Auble DT, Sirum-Connolly KL, Brinckerhoff CE. Transcriptional regulation of matrix metalloproteinase genes: role of AP-1 sequences. Matrix Suppl. 1992;1:200. - PubMed
-
- Brauchle M, Gluck D, Di PF, Han J, Gram H. Independent role of p38 and ERK1/2 mitogen-activated kinases in the upregulation of matrix metalloproteinase-1. Exp Cell Res. 2000;258:135–144. - PubMed
-
- Brinckerhoff CE, Matrisian LM. Matrix metalloproteinases: a tail of a frog that became a prince. Nat Rev Mol Cell Biol. 2002;3:207–214. - PubMed
Publication types
MeSH terms
Substances
Grants and funding
LinkOut - more resources
Full Text Sources
Other Literature Sources
Research Materials
Miscellaneous
