. 2010 Sep;58(12):1395-406.
doi: 10.1002/glia.21015.

Ethanol inhibits neuritogenesis induced by astrocyte muscarinic receptors

Affiliations

Ethanol inhibits neuritogenesis induced by astrocyte muscarinic receptors

Marina Guizzetti et al. Glia. 2010 Sep.

Abstract

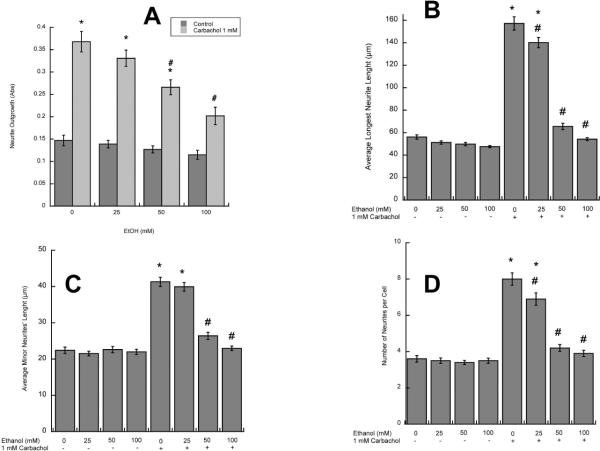
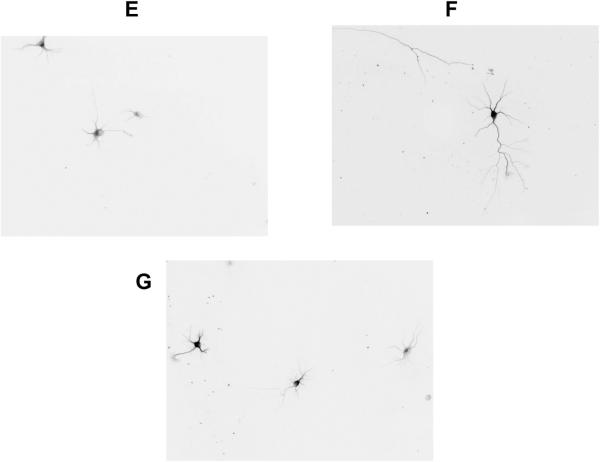
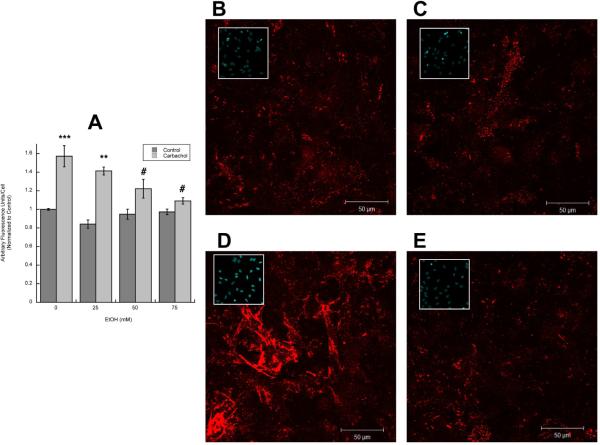
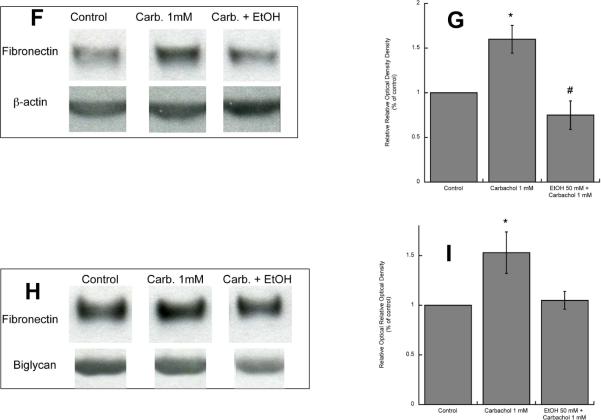
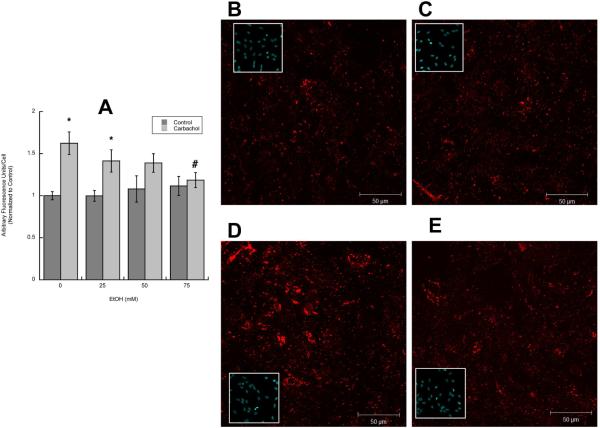
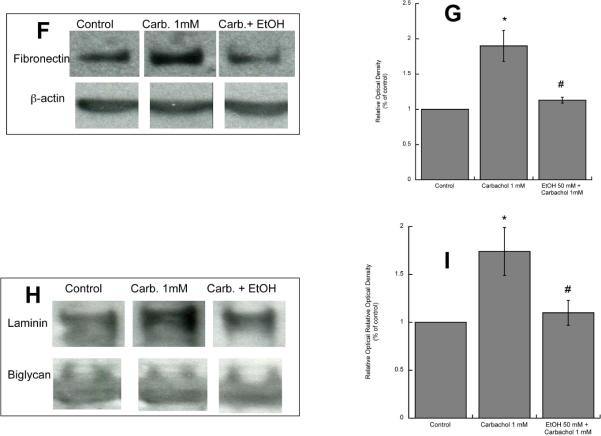
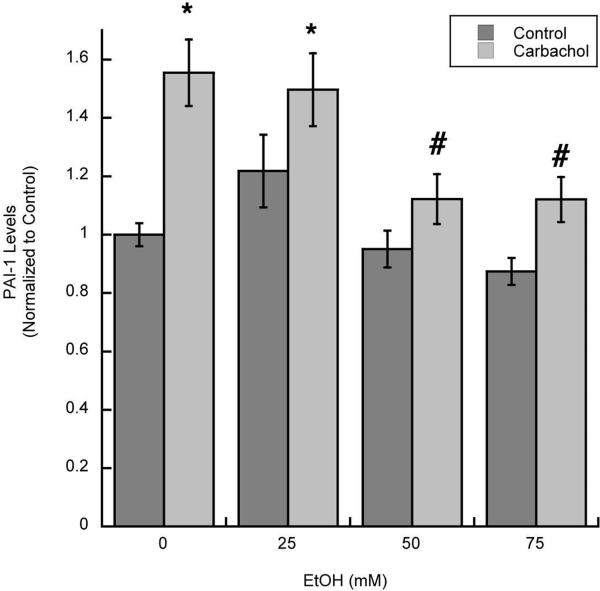
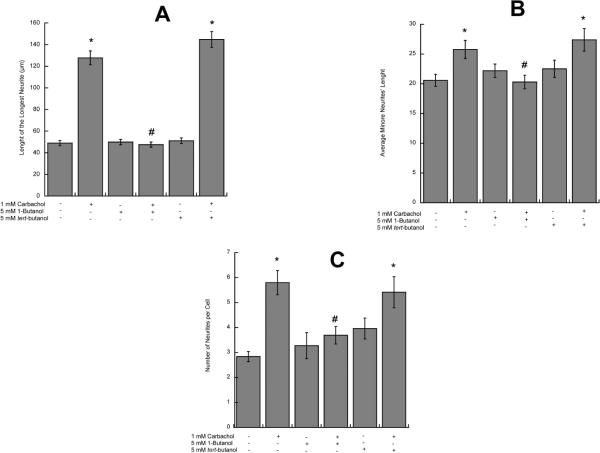
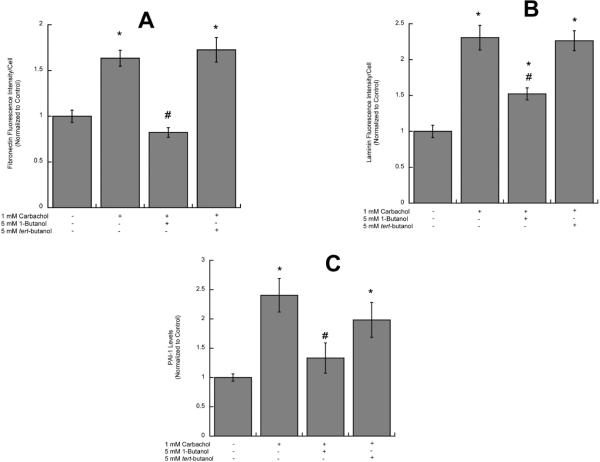
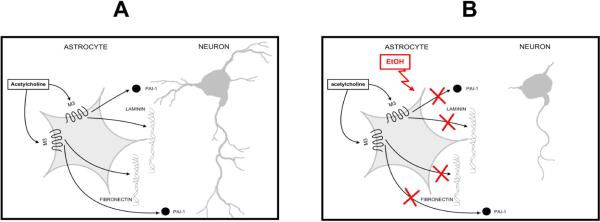
In utero alcohol exposure can lead to fetal alcohol spectrum disorders, characterized by cognitive and behavioral deficits. In vivo and in vitro studies have shown that ethanol alters neuronal development. We have recently shown that stimulation of M(3) muscarinic receptors in astrocytes increases the synthesis and release of fibronectin, laminin, and plasminogen activator inhibitor-1, causing neurite outgrowth in hippocampal neurons. As M(3) muscarinic receptor signaling in astroglial cells is strongly inhibited by ethanol, we hypothesized that ethanol may also inhibit neuritogenesis in hippocampal neurons induced by carbachol-stimulated astrocytes. In the present study, we report that the effect of carbachol-stimulated astrocytes on hippocampal neuron neurite outgrowth was inhibited in a concentration-dependent manner (25-100 mM) by ethanol. This effect was because of the inhibition of the release of fibronectin, laminin, and plasminogen activator inhibitor-1. Similar effects on neuritogenesis and on the release of astrocyte extracellular proteins were observed after the incubation of astrocytes with carbachol in the presence of 1-butanol, another short-chain alcohol, which like ethanol is a competitive substrate for phospholipase D, but not by tert-butanol, its analog that is not a substrate for this enzyme. This study identifies a potential novel mechanism involved in the developmental effects of ethanol mediated by the interaction of ethanol with cell signaling in astrocytes, leading to an impairment in neuron-astrocyte communication.


Figures

Figure 1
Figure 1. Effect of ethanol on carbachol-treated astrocyte-induced hippocampal neuron neurite outgrowth
A: Hippocampal neurons were incubated in the presence of astrocytes previously treated with 1 mM carbachol and/or 25, 50, or 100 mM ethanol. (A): Neurite proteins were quantified spectrophotometrically as described in Methods (n=6). (B, C, D): Morphometric analysis was carried out in hippocampal neurons immunostained with a neuron-specific βIII-tubulin antibody. Pictures were taken with a digital camera attached to a fluorescence microscope. Quantifications of the length of the longest neurite (A) and the length of minor neurites (B) were carried out using the software MetaMorph. C: number of processes per cell. The results (mean +/− S.E.) derive from the measurements of 60–80 cells per treatment. Representative fields of hippocampal neurons co-cultured with control (D), carbachol-treated (E) or carbachol- and 50 mM ethanol-treated (F) astrocytes are also shown. *: p<0.05 vs control; #: p<0.05 vs carbachol by the Dunnett post-hoc test.
Figure 2
Figure 2. Effect of ethanol on carbachol-induced increase in extracellular fibronectin
A: Astrocytes were stimulated for 24 h with 1 mM carbachol alone or in the presence of 25, 50, or 75 mM ethanol. After immunolabeling with a fibronectin antibody, cells were analyzed by confocal microscopy. Average fibronectin immunofluorescence per cell was quantified as described in “Methods”. *: p<0.05, vs. control; #: p<0.05 vs. carbachol by the Dunnett post hoc test (n=6). Representative fields of astrocytes treated with serum-free medium (Control; B); 50 mM ethanol (C); 1 mM carbachol (D); and 1 mM carbachol in the presence of 50 mM ethanol (E) are shown. (F, G,): Western blot analysis was carried out in the cell lysate of astrocytes treated for 24 h with 1 mM carbachol in the presence or absence of 50 mM ethanol. After protein transfer, membranes were labeled with a fibronectin (F, upper blot) or β-actin (F, lower blot) antibody. (G): Densitometric analysis of cellular levels of fibronectin normalized to β-actin is shown. (H, I): Proteins present in astrocyte-conditioned medium were separated by electrophoresis, transferred to PVDF membranes, and labeled with a fibronectin (H, upper blot) of byglican (H, lower blot) antibody and detected by Western blot. (I): Densitometric analysis of fibronectin in astrocyte-conditioned medium normalized to byglican is shown. *, p<0.05 vs. control; #, p<0.05 vs. carbachol (n=3).
Figure 3
Figure 3. Effect of ethanol on carbachol-induced increase in extracellular laminin
A: Astrocytes were stimulated for 24 h with 1 mM carbachol alone or in the presence of 25, 50, or 75 mM ethanol. After immunolabeling with a laminin-1 antibody, cells were analyzed by confocal microscopy. Average laminin immunofluorescence per cell was quantified as described in “Methods”. *: p<0.05, vs. control; #: p<0.05 vs. carbachol by the Dunnett post hoc test (n=6). Representative fields of astrocytes treated with serum-free medium (Control; B); 50 mM ethanol (C); 1 mM carbachol (D); and 1 mM carbachol in the presence of 50 mM ethanol (E) are shown. (F, G,): Western blot analysis was carried out in the cell lysate of astrocytes treated for 24 h with 1 mM carbachol in the presence or absence of 50 mM ethanol. After protein transfer, membranes were labeled with a laminin (F, upper blot) or β-actin (F, lower blot) antibody. (G): Densitometric analysis of cellular levels of laminin normalized to β-actin is shown. (H, I): Proteins present in astrocyte-conditioned medium were separated by electrophoresis, transferred to PVDF membranes, and labeled with a laminin (H, upper blot) of byglican (H, lower blot) antibody and detected by Western blot. (I): Densitometric analysis of laminin in astrocyte-conditioned medium normalized to byglican is shown. *, p<0.05 vs. control; #, p<0.05 vs. carbachol (n=3).
Figure 4
Figure 4. Effect of ethanol on the release of PAI-1 from carbachol-treated astrocytes
Media from astrocytes stimulated with 1 mM carbachol alone or in the presence of 25, 50, or 75 mM ethanol were collected and analyzed for PAI-1 levels by ELISA. *: p<0.05 vs. control; #: p<0.05 vs. carbachol by the Dunnett post hoc test; n=6.
Figure 5
Figure 5. Effect of 1-butanol and tert-butanol on carbachol-treated astrocytes-induced hippocampal neuron neuritogenesis
Hippocampal neurons were incubated in the presence of astrocytes previously treated with 1 mM carbachol, 1-butanol (5 mM), and/or tert-butanol (5 mM) for 24 h. Morphometric analysis was carried out in neurons fixed and immunostained with a neuron-specific βIII-tubulin antibody. Pictures were taken with a digital camera attached to a fluorescence microscope. Quantifications of the length of the longest neurite (A) and the length of minor neurites (B) were carried out using the software MetaMorph. C: number of processes per cell. The results (mean +/− S.E.) derive from the measurements of 50–70 cells per treatment. *: p<0.05 vs control; #: p<0.05 vs carbachol by the Dunnett post-hoc test.
Figure 6
Figure 6. Effect of 1-butanol and tert-butanol on carbachol-induced increase in extracellular fibronectin, laminin and PAI-1
Astrocytes were stimulated for 24 h with 1 mM carbachol alone or in the presence of 1-butanol (5 mM) or tert-butanol (5 mM). After 24 h, astrocytes were fixed and immunolabeled with a fibronectin (A) or a laminin (B) antibodies followed by a fluorescent secondary antibody and analyzed by confocal microscopy. A: Average fibronectin immunofluorescence per cell. B: Average laminin immunofluorescence per cell. C: Media from astrocytes stimulated with 1 mM carbachol alone or in the presence of 1-butanol (5 mM) or tert-butanol (5 mM) were collected and analyzed for PAI-1 levels by ELISA. *: p<0.05, vs. control; #: p<0.05 vs. carbachol by the Dunnett post hoc test (n=6).
Figure 7
Figure 7. Proposed model for astrocyte-neuron interaction and its inhibition by ethanol
Acetylcholine, present in the developing brain, stimulates M3 muscrinic receptors in astrocytes causing the release of factors that trigger neuritogenesis (A). Ethanol, by inhibiting muscarinic signaling, inhibits the release of factors from astrocytes and, consequently, prevents neurite outgrowth (B).

Similar articles

Cited by

References

    1. Armstrong DM, Bruce G, Hersh LB, Gage FH. Development of cholinergic neurons in the septal/diagonal band complex of the rat. Brain Res. 1987;433(2):249–56. - PubMed
    1. Balduini W, Murphy SD, Costa LG. Developmental changes in muscarinic receptor-stimulated phosphoinositide metabolism in rat brain. J Pharmacol Exp Ther. 1987;241(2):421–7. - PubMed
    1. Bearer CF, Swick AR, O'Riordan MA, Cheng G. Ethanol inhibits L1-mediated neurite outgrowth in postnatal rat cerebellar granule cells. J Biol Chem. 1999;274(19):13264–70. - PMC - PubMed
    1. Berman RF, Hannigan JH. Effects of prenatal alcohol exposure on the hippocampus: spatial behavior, electrophysiology, and neuroanatomy. Hippocampus. 2000;10(1):94–110. - PubMed
    1. Bertrand J, Floyd LL, Weber MK. Guidelines for identifying and referring persons with fetal alcohol syndrome. MMWR Recomm Rep. 2005;54(RR-11):1–14. - PubMed

Publication types

MeSH terms