

Comparative Study
doi: 10.1121/1.3453415.
Differences in distortion product otoacoustic emission phase recorded from human neonates using two popular probes
Affiliations
- PMID: 20649189
- PMCID: PMC2905449
- DOI: 10.1121/1.3453415
Item in Clipboard
Comparative Study
Differences in distortion product otoacoustic emission phase recorded from human neonates using two popular probes
J Acoust Soc Am.
2010 Jul.
Abstract
DPOAE (2f(1)-f(2)) phase was measured across a 3-octave frequency range from two groups of newborns using ER10B+ and ER10C probe microphones. A marked phase shift was noted in the mid-to-high frequency range for newborn data recorded with the ER10C only. In contrast, the ER10B+ produced phase that was approximately invariant as a function of frequency for most of the range. Probe-related phase shifts can be effectively eliminated by correcting for variations in the phases of the primary tones. Results highlight the importance of detecting and correcting for system-related phase shifts so they are not misinterpreted as cochlear in origin.
Figures
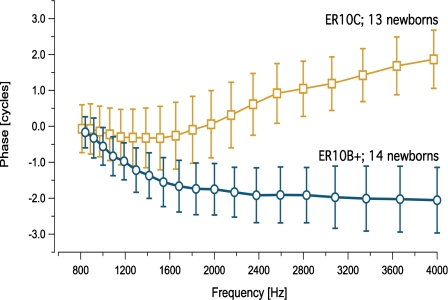
Mean DPOAE phase (±1 SD) averaged into 1/8 octave frequency bins for two groups of newborns: 13 infants tested with the ER10C probe (squares) and a second group of 14 newborns tested with the ER10B+ probe (circles). NOTE: DPOAE phase was unwrapped starting at 500 Hz though only data points >800 Hz are displayed due to poor SNR at the lowest frequencies.
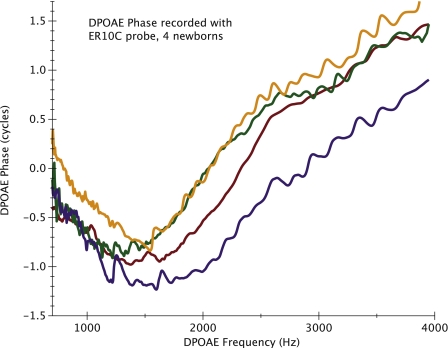
An example of four individual DPOAE phase vs. frequency functions from newborns tested with the ER10C probe.
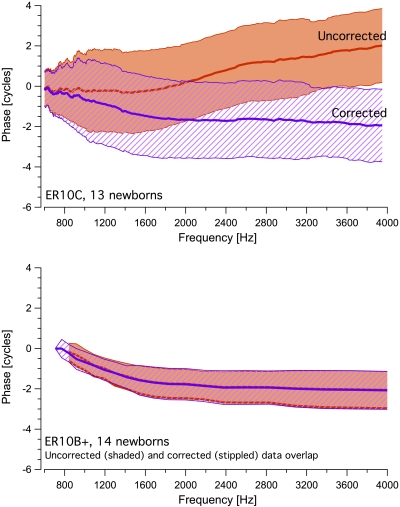
The newborn phase data displayed in Fig. 1 are shown again in this graphic. The stippled region represents the corrected phase derived by subtracting 2ϕ1-ϕ2 from the estimated phase of the DPOAE, where ϕ1, ϕ2 are the measured phases of the two primary tones. The shaded region represents the uncorrected phase values. Because of the significant overlap, the two regions are staggered slightly for display purposes in the lower panel.
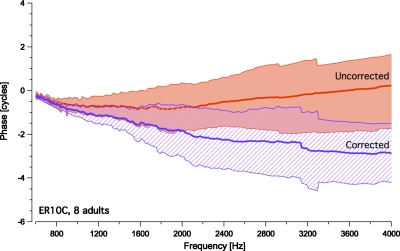
Mean DPOAE phase vs. frequency functions from 8 normal-hearing adults recorded with the ER10C probe (±1 SD). Data are shown corrected for variations in stimulus tone phases (stippled region) and in uncorrected form (shaded region).
Similar articles
-
Wideband acoustic immittance for assessing middle ear functioning for preterm neonates in the neonatal intensive care unit.S Afr J Commun Disord. 2017 Jun 28;64(1):e1-e11. doi: 10.4102/sajcd.v64i1.182. S Afr J Commun Disord. 2017. PMID: 28697607 Free PMC article.
-
Investigation of a significant increase in referrals during neonatal hearing screening: a comparison of Natus ALGO Portable and ALGO 3i.Int J Audiol. 2012 Jan;51(1):54-7. doi: 10.3109/14992027.2011.625985. Int J Audiol. 2012. PMID: 22212024
-
[Otoacoustic emissions for newborn hearing screening].Zhonghua Er Bi Yan Hou Ke Za Zhi. 1999 Feb;34(1):21-4. Zhonghua Er Bi Yan Hou Ke Za Zhi. 1999. PMID: 12764789 Chinese.
-
Overview: Infants and children with hearing loss-part I.Ment Retard Dev Disabil Res Rev. 2003;9(2):62-4. doi: 10.1002/mrdd.10070. Ment Retard Dev Disabil Res Rev. 2003. PMID: 12784222 Review. No abstract available.
-
[Diagnostics of the cochlear amplifier by means of DPOAE growth functions].HNO. 2005 Feb;53(2):121-33. doi: 10.1007/s00106-004-1179-9. HNO. 2005. PMID: 15549210 Review. German.
Cited by
-
Breaking away: violation of distortion emission phase-frequency invariance at low frequencies.J Acoust Soc Am. 2011 May;129(5):3115-22. doi: 10.1121/1.3569732. J Acoust Soc Am. 2011. PMID: 21568414 Free PMC article.
-
The breaking of cochlear scaling symmetry in human newborns and adults.J Acoust Soc Am. 2011 May;129(5):3104-14. doi: 10.1121/1.3569737. J Acoust Soc Am. 2011. PMID: 21568413 Free PMC article.
-
Frequency shifts in distortion-product otoacoustic emissions evoked by swept tones.J Acoust Soc Am. 2016 Aug;140(2):936. doi: 10.1121/1.4960592. J Acoust Soc Am. 2016. PMID: 27586726 Free PMC article.
References
-
- Heitmann, J., Waldman, B., Schnitzler, H. U., Plinkert, P. K., and Zenner, H. P. (1998). “Suppression of distortion product otoacoustic emissions (DPOAE) near 2f1-f2 removes DP-gram fine structure—Evidence for a second generator,” J. Acoust. Soc. Am. JASMAN 103, 1527–1531.10.1121/1.421290 - DOI
Publication types
MeSH terms
Grants and funding
LinkOut - more resources
Full Text Sources
Medical