Comparative Study
. 2010 Jul;128(1):332-41.
doi: 10.1121/1.3436540.

Temporal weighting of interaural time and level differences in high-rate click trains

Affiliations
Comparative Study

Temporal weighting of interaural time and level differences in high-rate click trains

Andrew D Brown et al. J Acoust Soc Am. 2010 Jul.

Abstract

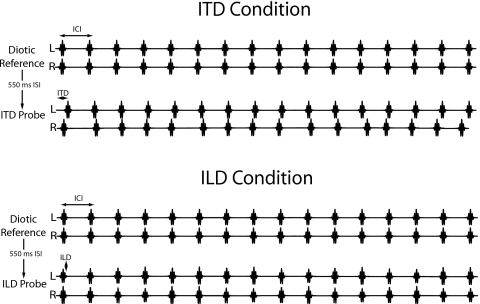
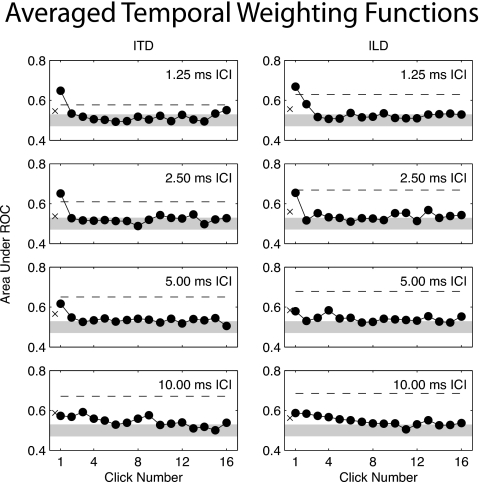
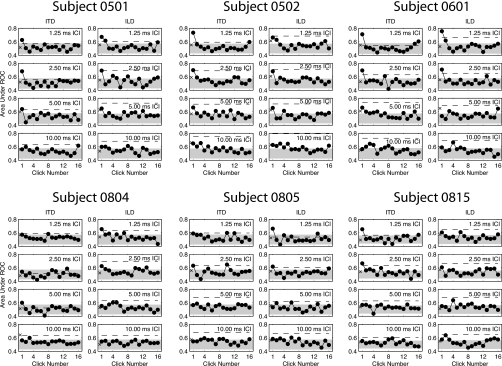
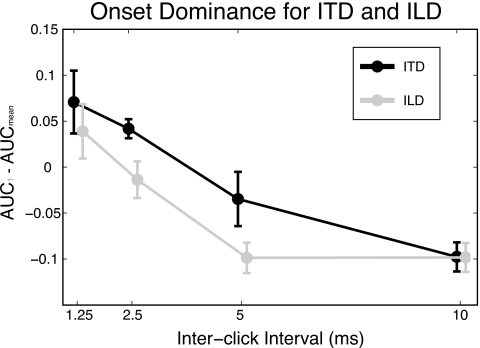
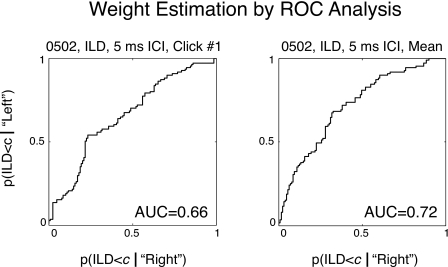
Temporal weighting functions (TWFs), quantifying sensitivity to interaural time differences (ITD) and interaural level differences (ILD) over the duration of brief stimuli, were measured in 6 normal hearing subjects using trains of 16 Gabor clicks centered at 4 kHz presented dichotically at 4 rates [inter-click intervals (ICI) of 10, 5, 2.5, and 1.25 ms]. Random ITD or ILD were imposed independently on each click in the train in separate conditions. The subject's task was to discriminate the lateral position of the click train ("left" or "right"). Receiver operating characteristic (ROC) analysis was then used to quantify the effectiveness or "weight" of each click according to individual click ITD or ILD. Although individual differences were evident, onset cues appeared to dominate at high rates. Onset dominance was apparent for both ITD and ILD at 1.25 ms ICI and for ITD at 2.5 ms ICI, but for neither cue at 5 or 10 ms ICI. Onset dominance was greater on average for ITD than ILD, although TWFs were qualitatively similar for the two cues. No evidence was found for "upweighting" of late-arriving ILD [Stecker, G. C., and Hafter, E. R. (2009), J. Acoust. Soc. Am. 125, 3914-3924].


Figures

Figure 1
Figure 1
Schematic illustration of stimuli (not to scale). Each trial consisted of a diotic reference stimulus followed by a probe stimulus. The reference stimulus was comprised of 16 equal-amplitude Gabor clicks presented synchronously to the left and right earphones. Following a 550 ms silent interval (ISI), an ITD or ILD probe stimulus was presented, comprised of 16 Gabor click pairs with random ITD or ILD imposed on each. In the ITD probe, each click pair carried an ITD drawn from a uniform distribution of ±100 μs about a base ITD of −100, 0, or 100 μs (0 in the above illustration); clicks were presented at equal amplitude to the two earphones in this condition. In the ILD probe, each click pair carried an ILD drawn from a uniform distribution of ±2 dB about a base ILD of −1, 0, or 1 dB (0 in the above illustration); clicks were presented synchronously to the two earphones in this condition. The inter-click interval (ICI), which corresponded to the rate of click presentation, was held constant within and between trials of a single run.
Figure 2
Figure 2
Temporal weighting functions (TWFs) averaged across subjects for ITD (left column) and ILD (right column) conditions for each inter-click interval (ICI) (rows). Within each panel, per-click ITD or ILD weights (AUC1…AUC16, filled circles) are plotted against click number to form the TWF; the weight of the mean ITD or ILD (AUCmean, dashed line) and the maximum ITD or ILD (AUCmax, cross) are plotted for comparison (see text). The shaded region plots the range of chance classification (see text).
Figure 3
Figure 3
Temporal weighting functions for individual subjects. Legend as in Fig. 2.
Figure 4
Figure 4
Cross-subject averages of AUC1-AUCmean against inter-click interval (ICI) for ITD (black) and ILD (gray) conditions. Error bars indicate one standard error of the mean. Data suggested a shift from onset dominance at high rates to cue-averaging at low rates, with greater cue-averaging for ILD than ITD.
Figure 5
Figure 5
Two ROC plots generated by the present method (subject 0502, ILD condition, 5 ms ICI, for click #1 ILD [left panel] and mean ILD [right panel]). In this example, the ROC was given by the accumulation of hits (ILDc for response “Left”) and false alarms (ILD<criterion c for response “Right”) as the criterion c was adjusted across all presented values of ILD, plotted as probabilities ranging from 0 to 1. The AUC, computed by integrating the ROC with respect to false-alarm probability, gives the percent correct classification of responses by the ILD of click #1 (left) and the mean ILD of the click train (right). The same procedure was applied for each combination of subject, condition, and classifier to generate the AUC weights given throughout the paper.

Similar articles

Cited by

References

    1. Akeroyd, M. A., and Bernstein, L. R. (2001). “The variation across time of sensitivity to interaural disparities: Behavioral measurements and quantitative analyses,” J. Acoust. Soc. Am. JASMAN 110, 2516–2526.10.1121/1.1412442 - DOI - PubMed
    1. Berg, B. G. (1989). “Analysis of weights in multiple observation tasks,” J. Acoust. Soc. Am. JASMAN 86, 1743–1746.10.1121/1.398605 - DOI - PubMed
    1. Bernstein, L. R., and Trahiotis, C. (1994). “Detection of interaural delay in high-frequency sinusoidally amplitude-modulated tones, two-tone complexes, and bands of noise,” J. Acoust. Soc. Am. JASMAN 95, 3561–3567.10.1121/1.409973 - DOI - PubMed
    1. Bernstein, L. R., and Trahiotis, C. (2002). “Enhancing sensitivity to interaural delays at high frequencies by using “transposed stimuli”,” J. Acoust. Soc. Am. JASMAN 112, 1026–1036.10.1121/1.1497620 - DOI - PubMed
    1. Blauert, J. (1997). Spatial Hearing: The Psychophysics of Human Sound Localization, revised ed. (MIT, Cambridge, MA: ).

Publication types