. 2010 Aug;160(7):1662-76.
doi: 10.1111/j.1476-5381.2010.00833.x.

High concentrations of dexmedetomidine inhibit compound action potentials in frog sciatic nerves without alpha(2) adrenoceptor activation

Affiliations

High concentrations of dexmedetomidine inhibit compound action potentials in frog sciatic nerves without alpha(2) adrenoceptor activation

Toshifumi Kosugi et al. Br J Pharmacol. 2010 Aug.

Abstract

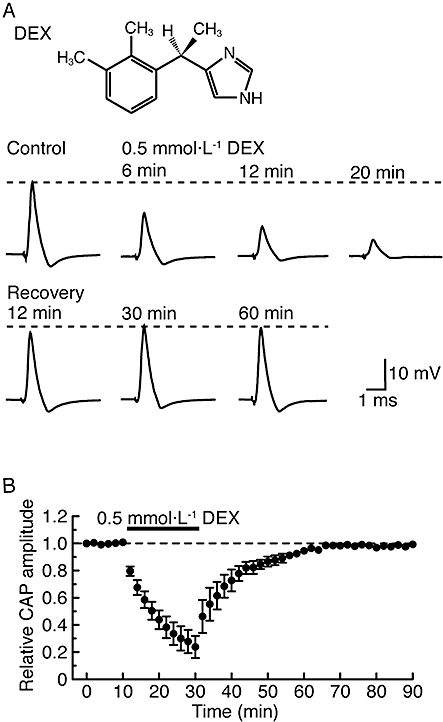
Background and purpose: Dexmedetomidine, an alpha(2)-adrenoceptor agonist, exhibits anti-nociceptive actions at the spinal cord and enhances the effect of local anaesthetics in the peripheral nervous system. Although the latter action may be attributed in part to inhibition of nerve conduction produced by dexmedetomidine, this has not been fully examined yet.

Experimental approach: We examined the effects of various adrenoceptor agonists including dexmedetomidine, and tetracaine, a local anaesthetic, on compound action potentials (CAPs) recorded from the frog sciatic nerve, using the air-gap method.

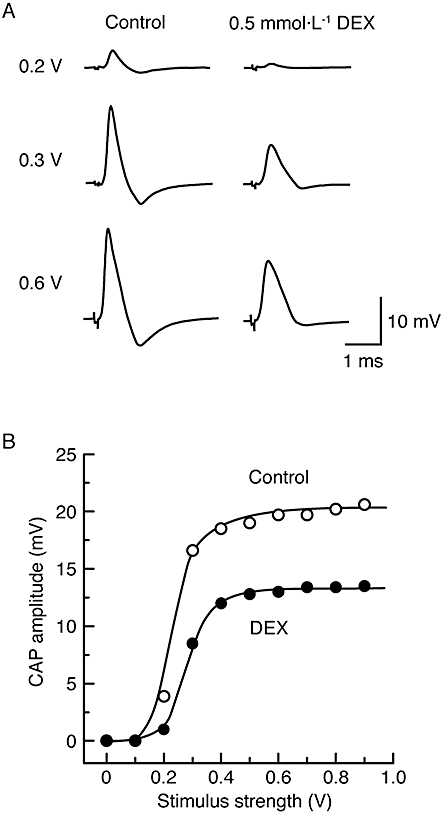
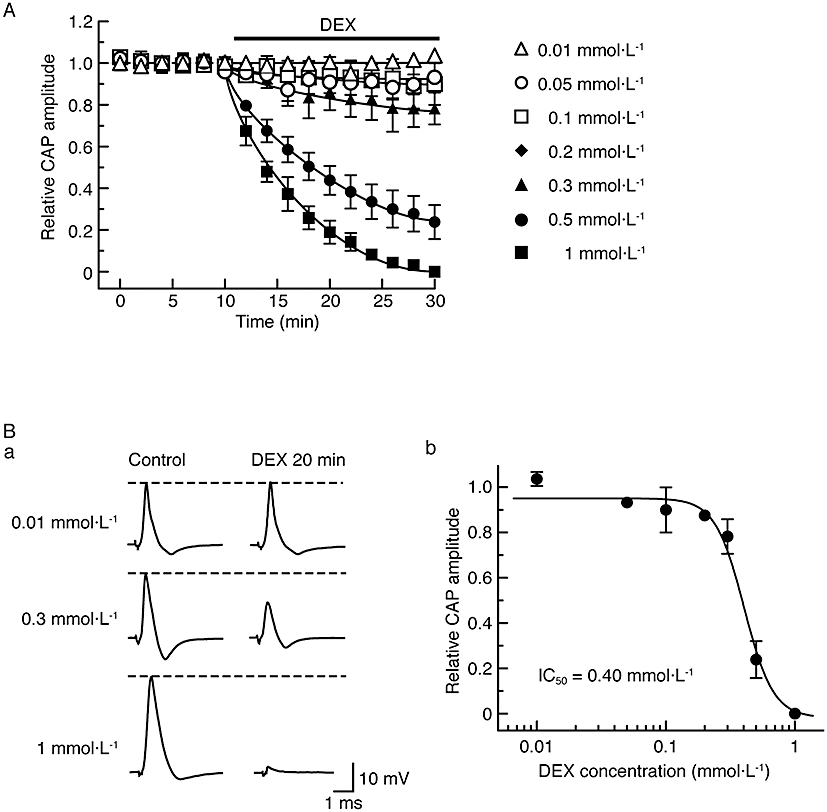
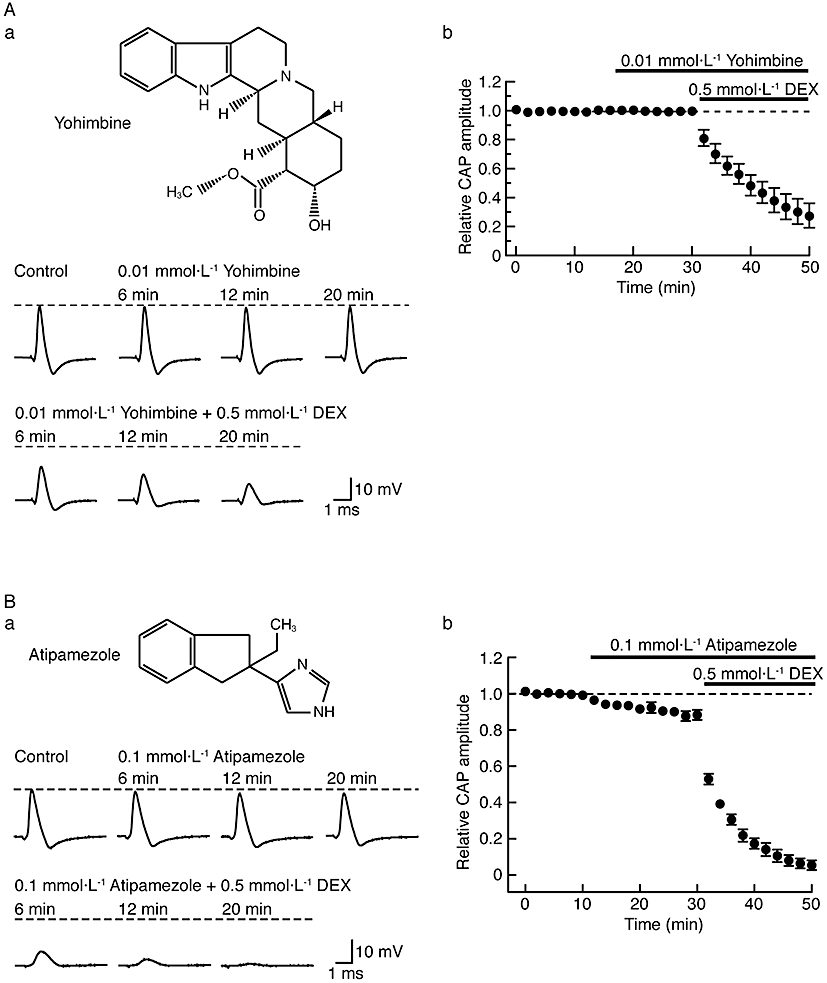
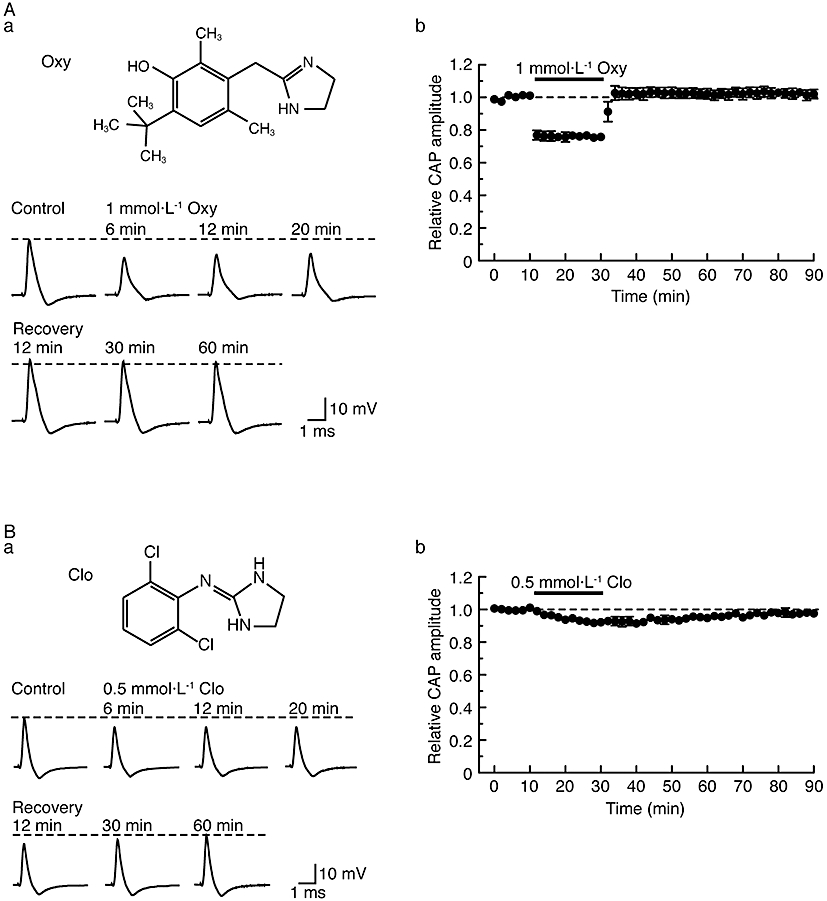
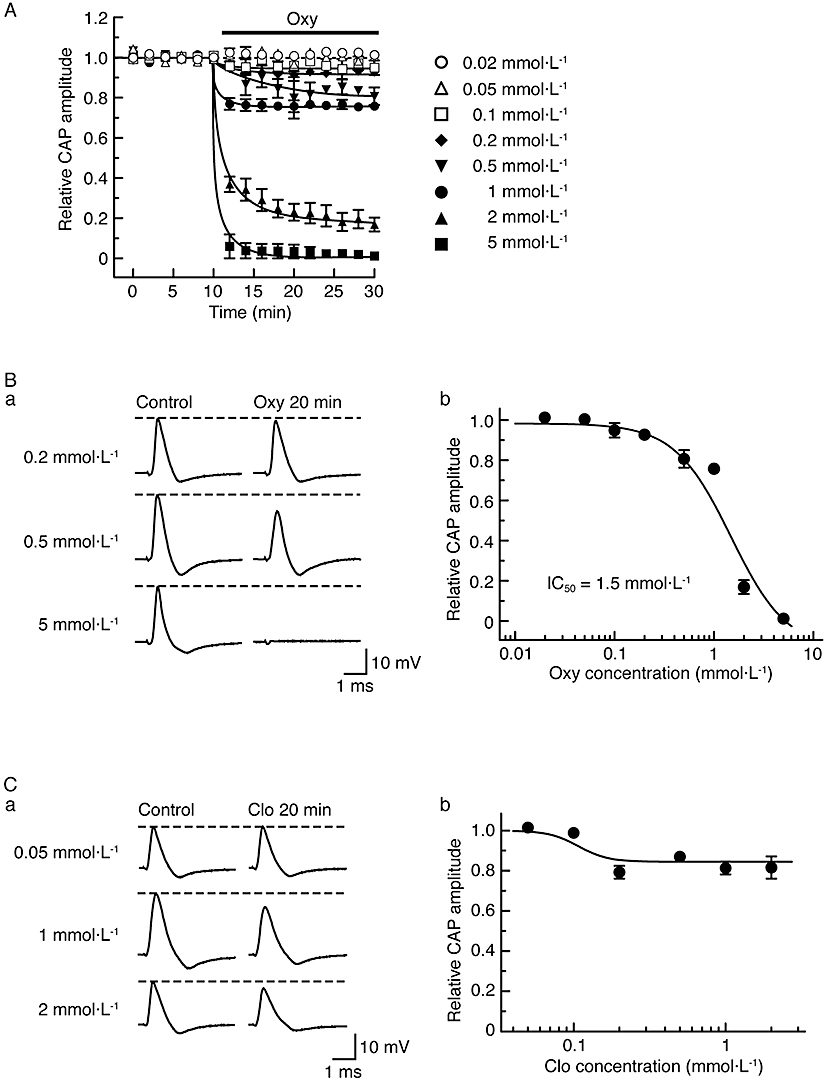
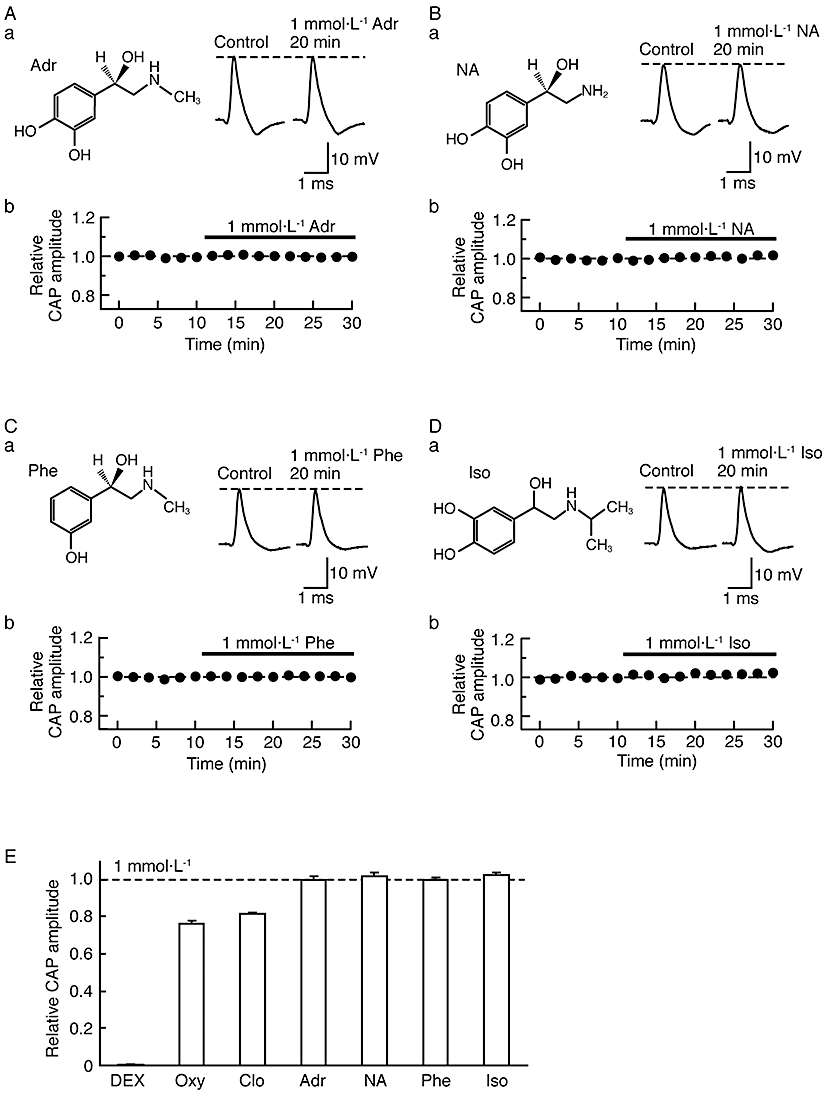
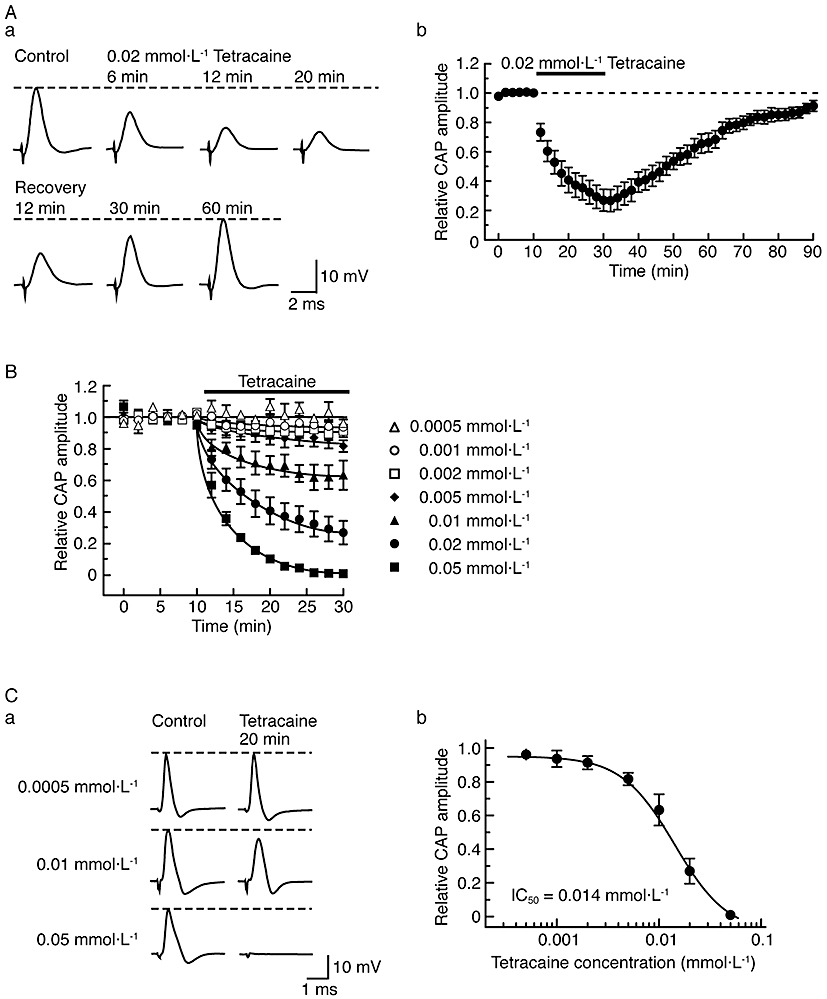
Key results: Dexmedetomidine reversibly and concentration-dependently reduced the peak amplitude of CAPs (IC(50)= 0.40 mmol x L(-1)). This action was not antagonized by two alpha(2)-adrenoceptor antagonists, yohimbine and atipamezole; the latter antagonist itself reduced CAP peak amplitude. Clonidine and oxymetazoline, two other alpha(2)-adrenoceptor agonists, also inhibited CAPs; the maximum effect of clonidine was only 20%, while oxymetazoline was less potent (IC(50)= 1.5 mmol x L(-1)) than dexmedetomidine. On the other hand, (+/-)-adrenaline, (+/-)-noradrenaline, alpha(1)-adrenoceptor agonist (-)-phenylephrine and beta-adrenoceptor agonist (-)-isoprenaline (each 1 mmol x L(-1)) had no effect on CAPs. Tetracaine reversibly reduced CAP peak amplitude (IC(50) of 0.014 mmol x L(-1)).

Conclusions and implications: Dexmedetomidine reduced CAP peak amplitude without alpha(2)-adrenoceptor activation (at concentrations >1000-fold higher than those used as alpha(2) adrenoceptor agonist), with a lower potency than tetracaine. CAPs were inhibited by other alpha(2) adrenoceptor agonists, oxymetazoline and clonidine, and also an alpha(2) adrenoceptor antagonist atipamezole. Thus, some drugs acting on alpha(2) adrenoceptors are able to block nerve conduction.


Figures

Figure 1
Figure 1
α2-Adrenoceptor agonist dexmedetomidine (DEX; 0.5 mmol·L−1) reversibly reduces the peak amplitude of compound action potentials (CAPs) recorded from frog sciatic nerve fibres. (A) Recordings of CAPs in the control, after 6, 12 and 20 min of exposure to dexmedetomidine and thereafter 12, 30 and 60 min in the absence of dexmedetomidine. Upper inset shows the chemical structure of dexmedetomidine (see Bhana et al., 2000). (B) Average time course of changes in CAP peak amplitudes following exposure to dexmedetomidine for 20 min, relative to that before the soaking, obtained from five sciatic nerves. The dexmedetomidine effect was close to a steady effect after 20 min of exposure.
Figure 2
Figure 2
The reduction in compound action potential (CAP) peak amplitude by dexmedetomidine (DEX; 0.5 mmol·L−1) is seen without a change in a threshold to elicit CAPs and with a decrease in maximal responses. (A) Recordings of CAPs elicited at 0.2, 0.3 and 0.6 V in the control (left) and after the action of dexmedetomidine for a period of 20 min (right). (B) The peak amplitudes of CAP before and after dexmedetomidine are plotted against stimulus strength used to elicit the CAP. The solid lines were drawn by eye.
Figure 3
Figure 3
Compound action potential (CAP) peak amplitude is reduced by dexmedetomidine (DEX) in a concentration-dependent manner. (A) Comparison in average time course among CAP peak amplitude reductions produced by dexmedetomidine at 0.01–1 mmol·L−1, obtained from 23 sciatic nerves. The solid lines were drawn by eye. (B) Concentration dependence for CAP peak amplitude reduction by dexmedetomidine. (Ba) Recordings of CAPs in the control (left) and after 20 min of exposure to dexmedetomidine at 0.01, 0.3 and 1 mmol·L−1 (right); these were obtained from different sciatic nerves. (Bb) The peak amplitude of CAP recorded from sciatic nerve fibres treated with dexmedetomidine at various concentrations for 20 min, relative to control, was plotted against dexmedetomidine concentration. Each of the data points was obtained from 3–5 sciatic nerves. The concentration-response curve was drawn according to the Hill equation (IC50 = 0.40 mmol·L−1, nH = 3.9).
Figure 4
Figure 4
Dexmedetomidine (DEX; 0.5 mmol·L−1)-induced reduction in compound action potential (CAP) peak amplitude is resistant to α2-adrenoceptor antagonists, yohimbine (0.01 mmol·L−1) and atipamezole (0.1 mmol·L−1). (A, B) Effects of DEX on CAP peak amplitude in the presence of α2 antagonists (A: yohimbine; B: atipamezole). (Aa, Ba) Recordings of CAPs in the control, after 6, 12 and 20 min of exposure to α2 antagonists (Aa: yohimbine; Ba: atipamezole) and thereafter 6, 12 and 20 min in the presence of DEX together with α2 antagonists (Aa: yohimbine; Ba: atipamezole). Upper insets in (Aa) and (Ba) show the chemical structures of yohimbine and atipamezole (see Virtanen, 1989; Westfall and Westfall, 2006), respectively. (Ab, Bb) Average time courses of changes in CAP peak amplitudes following treatment with α2 antagonists (Ab: yohimbine; Bb: atipamezole) and with both DEX and α2 antagonists (Ab: yohimbine; Bb: atipamezole), relative to that before drug treatment, obtained from four (Ab) or five (Bb) sciatic nerves. Note that atipamezole (0.1 mmol·L−1) itself reduces CAP peak amplitudes.
Figure 5
Figure 5
Other α2-adrenoceptor agonists, oxymetazoline (Oxy; 1 mmol·L−1) and clonidine (Clo; 0.5 mmol·L−1), also reversibly reduce compound action potential (CAP) peak amplitudes. (A, B) Effects of α2 agonists (A: Oxy; B: Clo) on CAP peak amplitudes. (Aa, Ba) Recordings of CAPs in the control, after 6, 12 and 20 min of exposure to α2 adrenoceptor agonists (A: Oxy; B: Clo) and thereafter 12, 30 and 60 min in the absence of α2 adrenoceptor agonists (A: Oxy; B: Clo). Upper insets in (Aa) and (Ba) show the chemical structures of oxymetazoline and clonidine, respectively (see Westfall and Westfall, 2006). (Ab, Bb) Average time courses of changes in CAP peak amplitudes following exposure to α2 adrenoceptor agonists (Ab: Oxy; Bb: Clo) for 20 min, relative to that before exposure, obtained from four (Ab) or five (Bb) sciatic nerves.
Figure 6
Figure 6
α2-Adrenoceptor agonists, oxymetazoline (Oxy) and clonidine (Clo), reduce compound action potential (CAP) peak amplitudes in a concentration-dependent manner. (A) Comparison in average time course among CAP peak amplitude reductions produced by oxymetazoline at 0.02–5 mmol·L−1, obtained from 25 sciatic nerves. The solid lines were drawn by eye. (B) Concentration dependence for the effect of oxymetazoline on CAPs. (Ba) Recordings of CAPs in the control (left) and after 20 min of exposure to oxymetazoline at 0.2, 0.5 and 5 mmol·L−1 (right); these were obtained from different sciatic nerves. (Bb) The peak amplitude of CAP recorded from sciatic nerve fibres treated with oxymetazoline at various concentrations for 20 min, relative to control, which was plotted against oxymetazoline concentration. Each of the data points was obtained from 3–4 sciatic nerves. The concentration-response curve in (Bb) was drawn according to the Hill equation (IC50 = 1.5 mmol·L−1, nH = 1.5). (C) Concentration dependence for CAP peak amplitude reduction by clonidine. (Ca) Recordings of CAPs in the control (left) and after 20 min of exposure to clonidine at 0.05, 1 and 2 mmol·L−1 (right); these were obtained from different sciatic nerves. (Cb) The peak amplitude of CAP recorded from sciatic nerve fibres treated with clonidine at various concentrations for 20 min, relative to control, was plotted against clonidine concentration. Each of the data points was obtained from 3–5 sciatic nerves.
Figure 7
Figure 7
Effects of various adrenoceptor agonists on compound action potentials (CAPs). (Aa, Ba, Ca, Da) Recordings of CAPs in the control (left) and after 20 min of exposure to (±)-adrenaline (Adr; Aa), (±)-noradrenaline (NA; Ba), α1-adrenoceptor agonist (-)-phenylephrine (Phe; Ca) or β-adrenoceptor agonist (-)-isoprenaline (Iso; Da) at 1 mmol·L−1 (right); these were obtained from different sciatic nerves. Insets in (Aa), (Ba), (Ca) and (Da) show the chemical structures of adrenaline, noradrenaline, phenylephrine and isoprenaline, respectively (see Westfall and Westfall, 2006). (Ab, Bb, Cb, Db) Average time courses of changes in CAP peak amplitudes following treatment with adrenaline (Ab; n = 3), noradrenaline (Bb; n = 3), phenylephrine (Cb; n = 3) or isoprenaline (Db; n = 3), relative to that before drug treatment. (E) CAP amplitude (Relative CAP amplitude) after 20 min of exposure to adrenoceptor agonists [dexmedetomidine (DEX), Oxy, Clo, Adr, NA, Phe and Iso; each 1 mmol·L−1], relative to control. The relative CAP amplitudes under the actions of DEX, oxymetazoline and clonidine were taken from Figures 3Bb, 6Bb and Cb, respectively.
Figure 8
Figure 8
Effect of tetracaine on compound action potentials (CAPs) recorded from frog sciatic nerve fibres. (A) Tetracaine at a concentration of 0.02 mmol·L−1 reversibly reduces CAP peak amplitudes. (Aa) Recordings of CAPs in the control, after 6, 12 and 20 min of exposure to tetracaine and thereafter 12, 30 and 60 min in the absence of tetracaine. (Ab) Average time course of changes in CAP peak amplitudes following exposure to tetracaine for 20 min, relative to that before treatment, obtained from seven sciatic nerves. (B) Comparison in average time course among CAP peak amplitude reductions produced by tetracaine at 0.0005–0.05 mmol·L−1, obtained from 28 sciatic nerves. The solid lines were drawn by eye. (C) Concentration dependence for CAP peak amplitude reduction by tetracaine. (Ca) Recordings of CAPs in the control (left) and after 20 min of exposure to tetracaine at 0.0005, 0.01 and 0.05 mmol·L−1 (right); these were obtained from different sciatic nerves. (Cb) The peak amplitude of CAP recorded from sciatic nerve fibres treated with tetracaine at various concentrations for 20 min, relative to control, was plotted against tetracaine concentration. Each of the data points was obtained from 3–7 sciatic nerves. The concentration-response curve was drawn according to the Hill equation (IC50 = 0.014 mmol·L−1, nH = 1.4).

Similar articles

Cited by

References

    1. Alexander SPH, Mathie A, Peters JA. Guide to Receptors and Channels (GRAC), 4th edn. Br J Pharmacol. 2009;158(Suppl 1):S1–S254. - PMC - PubMed
    1. Bhana N, Goa KL, McClellan KJ. Dexmedetomidine. Drugs. 2000;59:263–268. - PubMed
    1. Bräu ME, Vogel W, Hempelmann G. Fundamental properties of local anesthetics: half-maximal blocking concentrations for tonic block of Na+ and K+ channels in peripheral nerve. Anesth Analg. 1998;87:885–889. - PubMed
    1. Brummett CM, Norat MA, Palmisano JM, Lydic R. Perineural administration of dexmedetomidine in combination with bupivacaine enhances sensory and motor blockade in sciatic nerve block without inducing neurotoxicity in rat. Anesthesiology. 2008;109:502–511. - PMC - PubMed
    1. Butterworth JF, IV, Strichartz GR. The α2-adrenergic agonists clonidine and guanfacine produce tonic and phasic block of conduction in rat sciatic nerve fibers. Anesth Analg. 1993;76:295–301. - PubMed

MeSH terms

Substances