. 2010 Aug;160(7):1823-43.
doi: 10.1111/j.1476-5381.2010.00836.x.

14-Deoxyandrographolide desensitizes hepatocytes to tumour necrosis factor-alpha-induced apoptosis through calcium-dependent tumour necrosis factor receptor superfamily member 1A release via the NO/cGMP pathway

Affiliations

14-Deoxyandrographolide desensitizes hepatocytes to tumour necrosis factor-alpha-induced apoptosis through calcium-dependent tumour necrosis factor receptor superfamily member 1A release via the NO/cGMP pathway

D N Roy et al. Br J Pharmacol. 2010 Aug.

Abstract

Background and purpose: Andrographis paniculata (AP) has been found to display hepatoprotective effect, although the mechanism of action of the active compounds of AP in this context still remains unclear. Here, we evaluated the hepatoprotective efficacy of 14-deoxyandrographolide (14-DAG), a bioactive compound of AP, particularly its role in desensitization of hepatocytes to tumour necrosis factor-alpha (TNF-alpha)-induced signalling of apoptosis.

Experimental approach: TNF-alpha-mediated ligand receptor interaction in hepatocytes in the presence of 14-DAG was studied in vitro in primary hepatocyte cultures, with the help of co-immunoprecipitation, confocal microscopy and FACS analysis. Events associated with 14-DAG-induced TNFRSF1A release from hepatocytes were determined using immunoblotting, biochemical assay and fluorimetric studies. Pulse-chase experiments with radiolabelled TNF-alpha and detection of apoptotic nuclei by terminal transferase-mediated dUTP nick-end labelling were performed under in vivo conditions.

Key results: 14-DAG down-regulated the formation of death-inducing signalling complex, resulting in desensitization of hepatocytes to TNF-alpha-induced apoptosis. Pretreatment of hepatocytes with 14-DAG accentuated microsomal Ca-ATPase activity through induction of NO/cGMP pathway. This resulted in enhanced calcium influx into microsomal lumen with the formation of TNFRSF1A-ARTS-1-NUCB2 complex in cellular vesicles. It was followed by the release of full-length 55 kDa TNFRSF1A and a reduction in the number of cell surface TNFRSF1A, which eventually caused diminution of TNF-alpha signal in hepatocytes.

Conclusion and implication: Taken together, the results demonstrate for the first time that 14-DAG desensitizes hepatocytes to TNF-alpha-mediated apoptosis through the release of TNFRSF1A. This can be used as a strategy against cytokine-mediated hepatocyte apoptosis in liver dysfunctions.


Figures

Figure 1
Figure 1
Chemical structures of diterpenoids: (A) AG and (B) 14-DAG.
Figure 2
Figure 2
Protective effect of AG and 14-DAG on TNF-α-induced cell death in hepatocytes. (A) Hepatocytes were pre-incubated in the presence of different concentrations of AG or 14-DAG in culture media for 1 h. Cells were washed in PBS, centrifuged and further incubated with or without TNF-α (10 ng·mL−1) along with ActD (200 ng·mL−1) for 12 h. Cell death was measured by the MTT assay. The data are shown as a percentage of cell death (mean ± SD) of three independent experiments. *P < 0.05, **P < 0.02, ***P < 0.01 versus AG-treated cells. (B) Hepatocytes were pre-incubated with or without 10 nM of AG or 14-DAG at various time periods. Cells were harvested at indicated time (min) and further exposed to TNF-α (10 ng·mL−1) with ActD (200 ng·mL−1) for 12 h. The DNA fragmentation in hepatocytes was evaluated by performing a DNA nick-end labelling assay using FITC–dUTP incorporation, and these cells were enumerated on a flow cytometer. Results are representative of seven separate experiments with similar results.
Figure 3
Figure 3
14-DAG inhibited TNF-α-mediated DISC formation. (A) Hepatocytes were pretreated with 14-DAG (5, 10 and 15 nM) for 1 h and then exposed to TNF-α/ActD for 12 h. Control cells were treated with the vehicle, DMSO. Immunoreactive bands of the active caspase-3 fragment were analysed by Western blot. Glyceraldehyde-3-phosphate dehydrogenase was used as a loading control. Caspase-3 activity was determined by using the fluorometric substrates DEVD–AFC. The data are shown as mean ± SD of three independent experiments. *P < 0.02, **P < 0.01, versus TNF-α/ActD-treated cells. (B) Caspase-8 activity was also determined by using the fluorometric substrates IETD–AFC in different treatment groups similar to caspase-3. The data are shown as mean ± SD of three independent experiments. *P < 0.02, **P < 0.01, versus TNF-α/ActD-treated cells. (C) Hepatocytes were pretreated with 14-DAG for 1 h at 37°C followed by treatment with TNF-α (10 ng·mL−1) and ActD (200 ng·mL−1) for 1 h at 37°C. TNFRSF1A was immunoprecipitated from the cell lysate, and the immunoprecipitates (IPs) were electrophoresed and immunoblotted with anti-FADD, anti-TRADD and anti-caspase-8 (p43) antibodies. Densitometric analyses of IPs were performed. The data are shown as mean ± SD of three independent experiments. (D) Hepatocytes were pretreated with 14-DAG for 1 h followed by incubation in PBS (pH 7.4) containing biotinylated TNF-α (10 ng·mL−1). TNFRSF1A internalization in hepatocytes was viewed under laser scanning confocal microscope using streptavidin–FITC. The magnification of the photomicrograph is 100×. (E) Evaluation of TNFRSF1A internalization in the presence of 5, 10 and 15 nM 14-DAG (experimental conditions were same as D) was quantified by FACS analysis using CELL Quest software. Results are representative of seven independent experiments with similar results.
Figure 4
Figure 4
Studies on binding of 14-DAG to TNF-α. (A) The DNA ladder patterns were analysed in groups: (i) control hepatocytes were treated with vehicle (DMSO); (ii) hepatocytes were treated with TNF-α/ActD for 12 h; (iii) hepatocytes were exposed to 10 nM 14-DAG 1 h after treatment with TNF-α/ActD for 12 h; and (iv) hepatocytes were pre-incubated with 10 nM 14-DAG for 1 h, then exposed to TNF-α/ActD for 12 h. Results are representative of five independent experiments. (B) The binding of TNF-α to TNFRSF1A (TNFR1) was studied using TNFRSF1A-coated elisa plate. 14-DAG (at concentrations 5, 10, 15, 20 nM) was added to TNFRSF1A-coated elisa plates along with TNF-α (1 µg·mL−1). WP9QY is used as a positive control. W/O represents nothing was there except TNF-α and TNFRSF1A in the well. The data are shown as mean ± SD of three independent experiments.
Figure 5
Figure 5
14-DAG induced release of cellular TNFRSF1A (TNFR1) from hepatocytes. (A) Cell lysates (40 µg) were collected from 14-DAG-treated (1 h at 37°C) hepatocytes and untreated hepatocytes. Supernatants from the culture media were collected from same groups of treatment. Proteins were separated by SDS–PAGE, transferred into nitrocellulose membrane and reacted with antibodies against TNFRSF1A (55 kDa). Densitometric analyses of immunoblots were done. The data are mean ± SD of five independent experiments. (B) Hepatocytes were treated with 14-DAG for 10 min at 37°C. The association among endogenous NUCB2, ARTS-1 and TNFRSF1A was observed in cell lysate by a co-immunoprecipitation experiment. Anti-NUCB2, anti-ARTS-1 and anti-TNFRSF1A antibodies were used to detect the presence of NUCB2, ARTS-1 and TNFRSF1A proteins in the complex. Densitometric analyses of immunoprecipitates were done. The data are shown as mean ± SD of three independent experiments. (C) TNFRSF1A (55 kDa) released in the media after treatment with 14-DAG at different concentrations (5–20 nM) for 1 h was measured by elisa. The data are shown as mean ± SD of three independent experiments. **P < 0.02, ***P < 0.01 (D) FACS analysis of TNFRSF1A in membranes of hepatocytes was done after different time periods (0, 15, 30 and 45 min, and 1, 12 and 24 h) of treatment with 14-DAG using anti-TNFRSF1A antibody tagged with FITC. Results are representative of four independent experiments with similar results. (E) Levels of mRNA for TNFRSF1A (at 0, 1, 10 and 24 h after 14-DAG treatment) in hepatocytes were quantified by RT–PCR assay using specific primers as described in Methods. The data are shown as mean ± SD of three independent experiments. (F) One group of hepatocytes was incubated with PMA (10 ng·mL−1) for 1 h, and another group of hepatocytes was pre-incubated with TAPI-2 (10 mM) for 1 h before activation with PMA, the other group was treated with 14-DAG (10 nM) for 1 h. Supernatants of culture media were collected from these three groups. Proteins were separated by SDS–PAGE, transferred into nitrocellulose membrane and reacted with antibodies against TNFRSF1A (28 kDa). This experiment was performed three times independently. (G) TNFRSF1A (55 kDa) released from hepatocytes into the media after treatment with 14-DAG (10 nM) for 1 h, and in another group of hepatocytes pre-incubated with TAPI-2 (10 mM) for 1 h before treatment with 14-DAG (10 nM) for 1 h, was measured by elisa. The data are shown as mean ± SD of three independent experiments. **P < 0.01 versus 14-DAG-treated group.
Figure 6
Figure 6
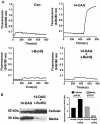
14-DAG treatment increased free calcium in microsomal lumen. (A) Microsomal lumen free calcium was measured using mag-fura-2 AM loaded cells as fluorescence ratio of 340/380 nm. Free calcium of ER was traced in control hepatocytes, hepatocytes treated with 14-DAG (10 nM), hepatocytes treated with t-BuHQ (100 µM) and hepatocytes simultaneously treated with 14-DAG (10 nM) and t-BuHQ (100 µM). This kinetic was followed for 800 s. Results are representative of three independent experiments with similar results. (B) TNFRSF1A (TNFR1) in cellular lysate and that correspondingly released in culture media were determined by Western blot. The hepatocytes were treated with 14-DAG (10 nM) with or without t-BuHQ (100 µM) for 1 h at 37°C. Densitometric analyses of immunoblots were done. The data are shown as mean ± SD of three independent experiments.
Figure 7
Figure 7
NO/cGMP modulates ER Ca-ATPase activity in 14-DAG-treated cells. (A) Kinetics of Ca-ATPase activity was measured in microsome of hepatocytes treated with or without 14-DAG in the presence of KT5823 180 nM, l-NAME 100 µM, t-BuHQ 100 µM, 8-Br-cGMP 100 µM and Na-nitroprusside 10 µM. All measurements were made at room temperature. The data represent mean ± SD of three independent experiments. (B) Kinetics of Ca-ATPase activity were measured in microsome of hepatocytes treated with or without 14-DAG in the presence of l-NAME 100 µM and l-NIL 100 µM for 30 min. All measurements were made at room temperature. The data represent mean ± SD of three independent experiments. (C) NO was measured in 14-DAG-treated hepatocytes in the presence or absence of l-NAME (100 µM) using the membrane-permeable fluorescent indicator DAF-2/DA. Results are representative of four independent experiments. (D) cGMP was measured in hepatocytes in response to 14-DAG treatment with or without KT5823 (180 nM). The data represent mean ± SD of three independent experiments. (E) Cellular TNFRSF1A (TNFR1) and TNFRSF1A released in the media were determined where the hepatocytes were treated with 14-DAG, cGMP and 14-DAG in the presence of KT5823. Densitometric analyses of immunoblots were performed. The data are shown as mean ± SD of four independent experiments.
Figure 8
Figure 8
14-DAG protects rats from TNF-α-mediated liver injury. Animals were administered 14-DAG (40 mg·kg−1 body weight, i.p.), followed 2 h later by ActD (800 µg·kg−1, i.p.) together with TNF-α (5 µg·kg−1 body weight) infused in a bolus dose into the tail vein. (A) The ALT level in plasma was measured after 4 h of TNF-α/ActD treatment. The data represent mean ± SD of three independent experiments. (B) Photomicrographs of liver sections from animals treated with TNF-α/ActD treatment were stained by TUNEL technique and counterstained with haematoxylin. Apoptotic nuclei are indicated by arrows. The magnification of the photomicrograph is 40×. Results are representative of three independent experiments. (C) Animals were injected with 14-DAG (40 mg·kg−1 body weight, i.p.) and then 2 h later [125I]-TNF-α (10 µCi)/ActD was infused in a bolus dose into the tail vein. Binding of 125I-labelled TNF-α in hepatocytes was evaluated by a gamma counter after 45 and 90 min. The data represent mean ± SD of three independent experiments. **P < 0.02, ***P < 0.01 versus TNF-α-treated cells at corresponding time. (D) The percentage of apoptotic nuclei was quantified from the photomicrographs of liver sections, which were stained by TUNEL technique and counterstained with haematoxylin, and was analysed in the following groups: (i) TNF-α/ActD induction; (ii) 14-DAG treatment followed by TNF-α/ActD induction; and (iii) t-BuHQ (a single i.p. dose of 1.0 mmoL·kg−1 body weight in 0.15 mL of ethanol) treatment for 1 h then 14-DAG treatment and followed by TNF-α/ActD induction. The data represent mean ± SD of three independent experiments. The rats were treated with d-GalN (600 mg·kg−1, i.p.) and TNF-α (5 µg·kg−1 body weight, i.v.) after 2 h of 14-DAG treatment. (E) ALT levels in plasma were measured after 4 h of TNF-α/d-GalN treatment. The data represent mean ± SD of three independent experiments. (F) FACS analysis of DNA end labelling with FITC–dUTP in hepatocytes after 4 h of TNF-α/d-GalN treatment in rats. Cell aggregates were gated out with PI staining, and FITC fluorescence was measured relative to a horizontal gate set by analysis of apoptotic and non-apoptotic hepatocytes. The data are representative of three independent experiments with similar result. (G) The release of TNFRSF1A (TNFR1) in plasma of animals treated with 14-DAG (40 mg·kg−1 body weight, i.p.). TNFRSF1A (55 kDa) present in the plasma at various time periods (30 min, and 1 and 2 h) after 14-DAG treatment was analysed by immunoblotting. Densitometric analyses of immunoblots were done. The data are shown as mean ± SD of three independent experiments.
Figure 9
Figure 9
Effectiveness of 14-DAG post-treatment of rats is time dependent. Animals were administered TNF-α (5 µg·kg−1 body weight) infused in a bolus dose into the tail vein followed by an i.v. injection of 14-DAG (40 mg·kg−1 body weight), 20 and 40 min later. The liver was excised 4 h after the initial stimulus (TNF-α). Nuclear fractions were collected at 4°C. NF-κβ (p65) was identified in the nuclear extract by Western blot analysis. The bands corresponding to NF-κβ (p65) were quantified by densitometry. The data are shown as mean ± SD of three independent experiments.

Similar articles

Cited by

References

    1. Alexander SPH, Mathie A, Peters JA. Guide to Receptors and Channels (GRAC) Br J Pharmacol. 2009;158(Suppl. 1):S1–S254. - PMC - PubMed
    1. Bhattacharyya K, Kar T, Bocelli G, Cantoni A, Pramanick S, Banerjee S, et al. Reduction of 14-deoxyandrographolide. Acta Cryst. 2005;E61:o2743–o2745.
    1. Brakebusch C, Varfomeev EE, Batkin M, Wallach D. Structural requirements for inducible shedding of the p55 tumor necrosis factor receptor. J Biol Chem. 1994;269:32488–32496. - PubMed
    1. Burgos AF, Loyola M, Hidalgo MA, Labranche TP, Hancke JL. Effect of 14-deoxyandrographolide on calcium-mediated rat uterine smooth muscle contractility. Phytother Res. 2003;17:1011–1015. - PubMed
    1. Burgos RA, Hidalgo MA, Monsalve J, LaBranche TP, Eyre P, Hancke JL. 14-Deoxyandrographolide as a platelet activating factor antagonist in bovine neutrophils. Planta Med. 2005;71:604–608. - PubMed

Publication types

MeSH terms

LinkOut - more resources