. 2010 Jul 23:11:395.
doi: 10.1186/1471-2105-11-395.

MZmine 2: modular framework for processing, visualizing, and analyzing mass spectrometry-based molecular profile data

Affiliations

MZmine 2: modular framework for processing, visualizing, and analyzing mass spectrometry-based molecular profile data

Tomás Pluskal et al. BMC Bioinformatics. .

Abstract

Background: Mass spectrometry (MS) coupled with online separation methods is commonly applied for differential and quantitative profiling of biological samples in metabolomic as well as proteomic research. Such approaches are used for systems biology, functional genomics, and biomarker discovery, among others. An ongoing challenge of these molecular profiling approaches, however, is the development of better data processing methods. Here we introduce a new generation of a popular open-source data processing toolbox, MZmine 2.

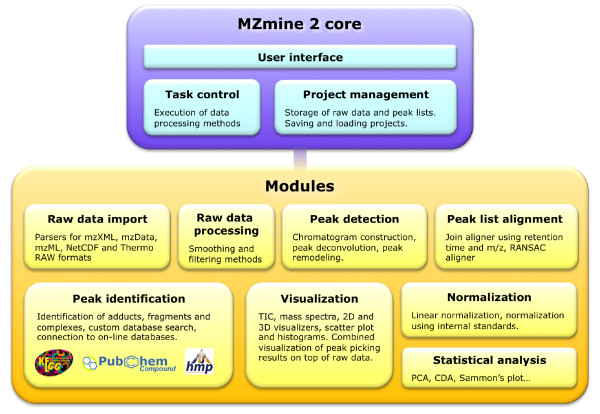
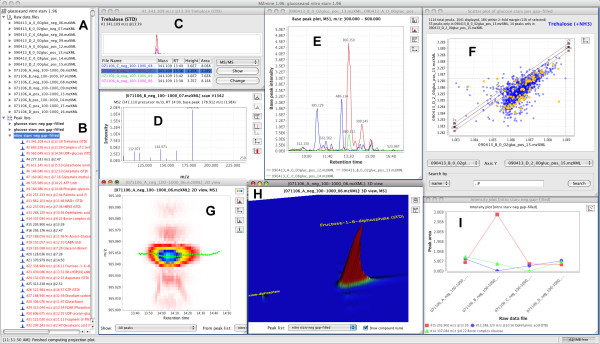
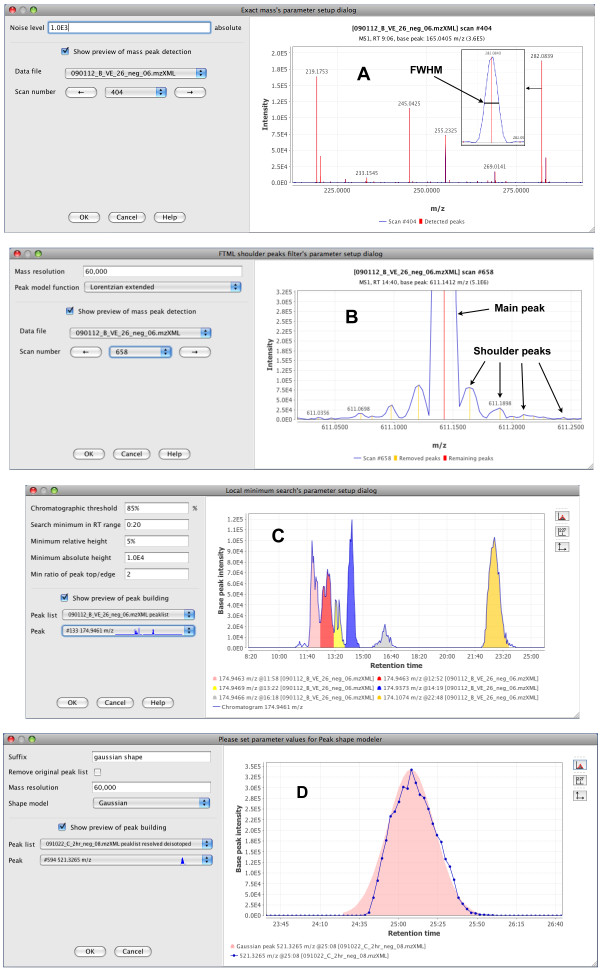
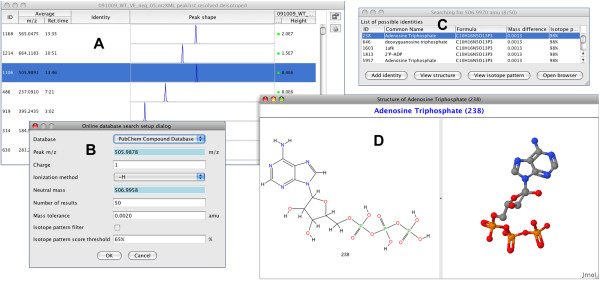
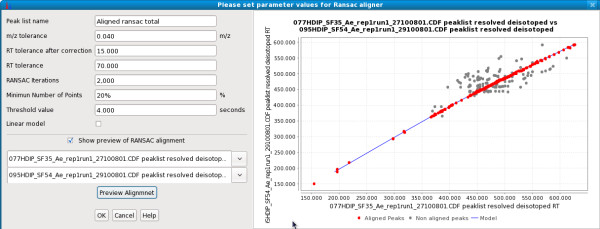
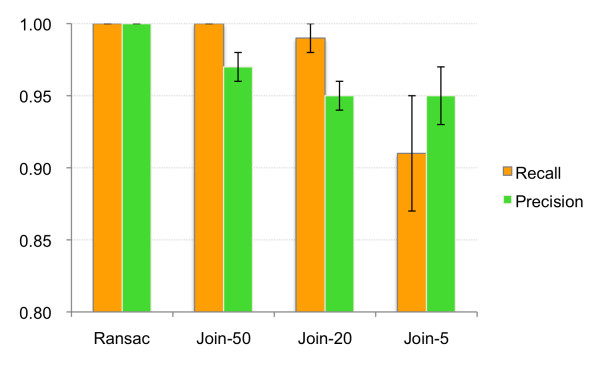
Results: A key concept of the MZmine 2 software design is the strict separation of core functionality and data processing modules, with emphasis on easy usability and support for high-resolution spectra processing. Data processing modules take advantage of embedded visualization tools, allowing for immediate previews of parameter settings. Newly introduced functionality includes the identification of peaks using online databases, MSn data support, improved isotope pattern support, scatter plot visualization, and a new method for peak list alignment based on the random sample consensus (RANSAC) algorithm. The performance of the RANSAC alignment was evaluated using synthetic datasets as well as actual experimental data, and the results were compared to those obtained using other alignment algorithms.

Conclusions: MZmine 2 is freely available under a GNU GPL license and can be obtained from the project website at: http://mzmine.sourceforge.net/. The current version of MZmine 2 is suitable for processing large batches of data and has been applied to both targeted and non-targeted metabolomic analyses.


Figures

Figure 1
Figure 1
MZmine 2 software architecture and its main modules
Figure 2
Figure 2
Screenshot of MZmine 2 showing multiple visualization modules. The specific panels included are: (A) imported samples, (B) peak lists including single peak list contents, (C) peak shapes for an identified metabolite across multiple samples, (D) MS/MS spectrum of a metabolite, (E) combined base peak plot for multiple samples, (F) scatter plot of peak areas across two samples, (G) 2D plot of a detected peak, mass-to-charge ratio vs. retention time, (H) 3D view of a detected peak, and (I) intensity plot for specific peaks across multiple samples.
Figure 3
Figure 3
Peak detection modules with previews. (A) Mass detection (centroiding) module. Recognized m/z peaks are shown in red. In the insets, details of a single m/z peak are shown, indicating the full width at half maximum approach to the m/z value calculation. (B) Fourier transform mass spectrometry shoulder peaks filter. In the preview panel, the main detected peak is indicated with the red line, while shoulder peaks are indicated with the yellow lines. (C) Peak deconvolution. Each individual recognized peak within the chromatogram is indicated by a different color. (D) Experimental peak shape modeler. A Gaussian peak model (pink) is fitted to the deconvoluted chromatographic peak's data points (blue).
Figure 4
Figure 4
Peak identification using the PubChem Compound database. (A) A peak list showing the row selected for identification. (B) Dialog for setting search parameters. (C) Table of candidates obtained from the database within a given mass tolerance. (D) 2D and 3D structural views of the candidate compound.
Figure 5
Figure 5
RANSAC aligner. Dialog shows preview of RANSAC alignment of two peak lists using the given parameters. Each possible candidate alignment (peak pair) within a defined m/z and retention time tolerance is shown as a dot. A model is fitted to the data (blue line) and red dots indicate those fitting to the model and therefore selected for the final alignment.
Figure 6
Figure 6
Performance comparison of RANSAC aligner and Join aligner for 12 synthetic datasets. For each dataset, peak lists were aligned using the RANSAC aligner and the Join aligner with three different retention time tolerance thresholds (50 s, 20 s, and 5 s). Plot shows the average recall and precision values for all datasets. Error bars indicate standard deviations.

Similar articles

Cited by

References

    1. Katajamaa M, Oresic M. Data processing for mass spectrometry-based metabolomics. J Chromatogr A. 2007;1158(1-2):318–328. doi: 10.1016/j.chroma.2007.04.021. - DOI - PubMed
    1. Orchard S, Hoogland C, Bairoch A, Eisenacher M, Kraus HJ, Binz PA. Managing the data explosion. A report on the HUPO-PSI Workshop. August 2008, Amsterdam, The Netherlands. Proteomics. 2009;9(3):499–501. doi: 10.1002/pmic.200800838. - DOI - PubMed
    1. Katajamaa M, Miettinen J, Oresic M. MZmine: toolbox for processing and visualization of mass spectrometry based molecular profile data. Bioinformatics. 2006;22(5):634–636. doi: 10.1093/bioinformatics/btk039. - DOI - PubMed
    1. Katajamaa M, Oresic M. Processing methods for differential analysis of LC/MS profile data. BMC Bioinformatics. 2005;6:179. doi: 10.1186/1471-2105-6-179. - DOI - PMC - PubMed
    1. Laaksonen R, Katajamaa M, Paiva H, Sysi-Aho M, Saarinen L, Junni P, Lutjohann D, Smet J, Van Coster R, Seppanen-Laakso T, Lehtimäki T, Soini J, Oresic M. A systems biology strategy reveals biological pathways and plasma biomarker candidates for potentially toxic statin-induced changes in muscle. PLoS One. 2006;1:e97. doi: 10.1371/journal.pone.0000097. - DOI - PMC - PubMed

Publication types