. 2010 Oct 27;170(3):827-38.
doi: 10.1016/j.neuroscience.2010.07.007. Epub 2010 Jul 25.

Spontaneous rhythmogenic capabilities of sympathetic neuronal assemblies in the rat spinal cord slice

Affiliations

Spontaneous rhythmogenic capabilities of sympathetic neuronal assemblies in the rat spinal cord slice

M L Pierce et al. Neuroscience. .

Abstract

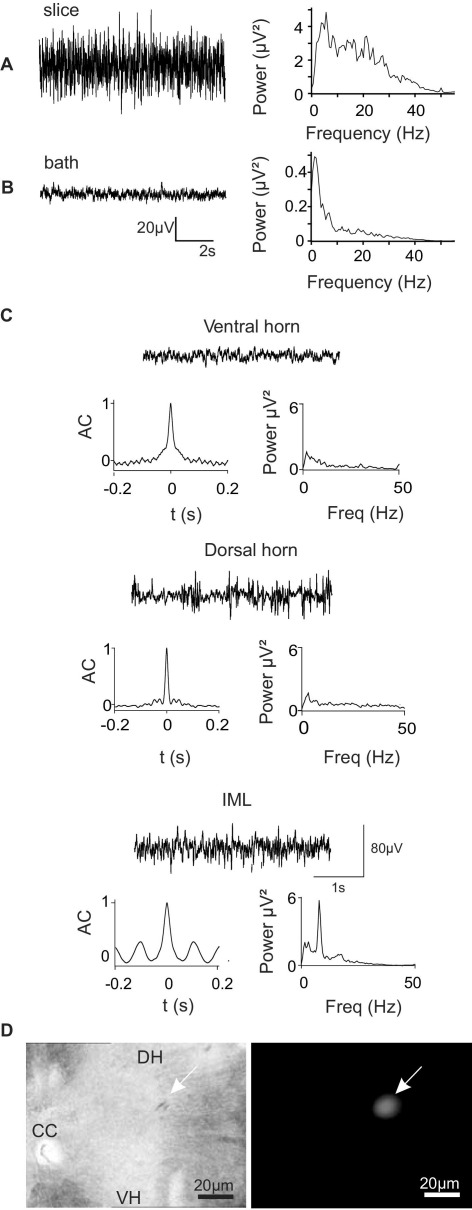
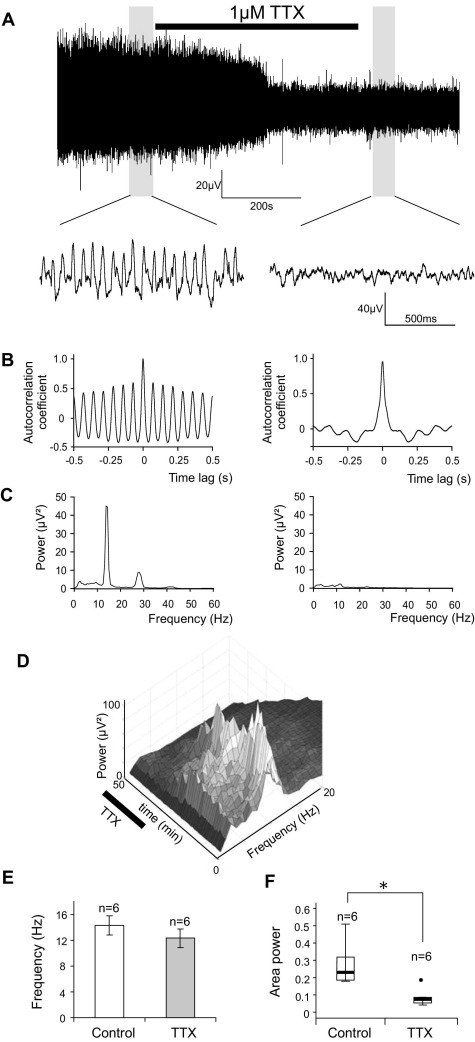
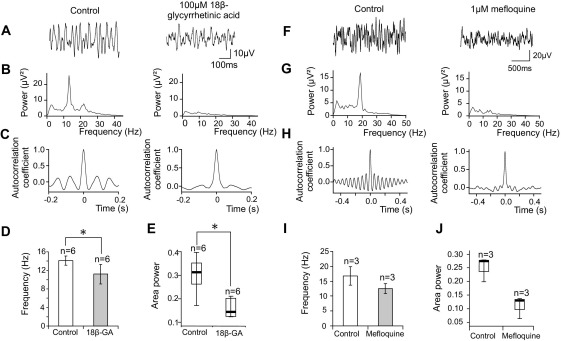
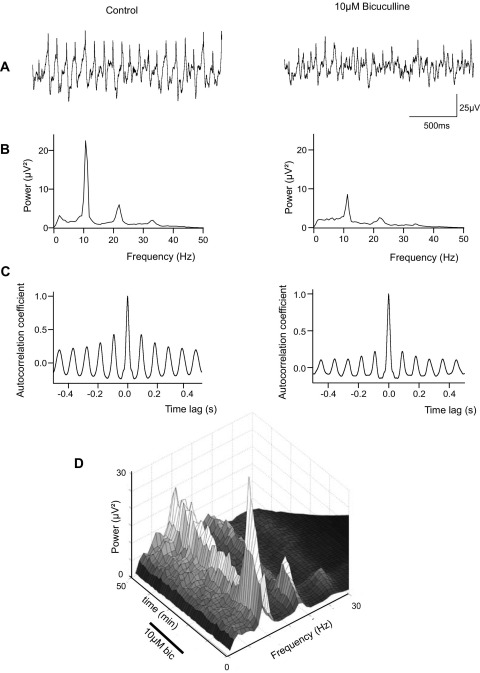
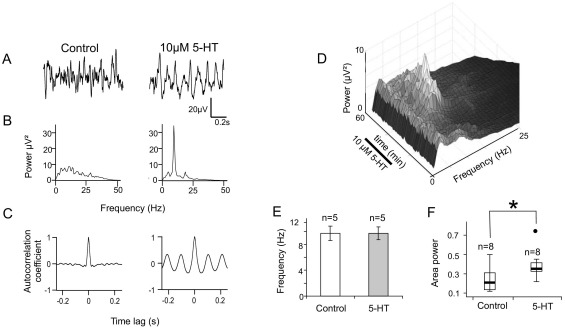
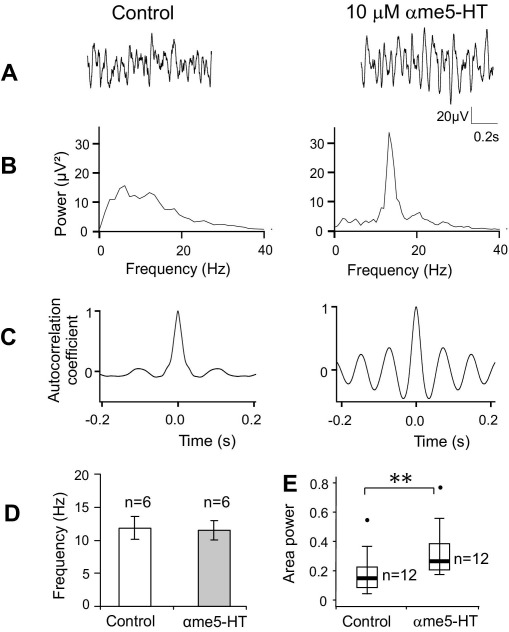
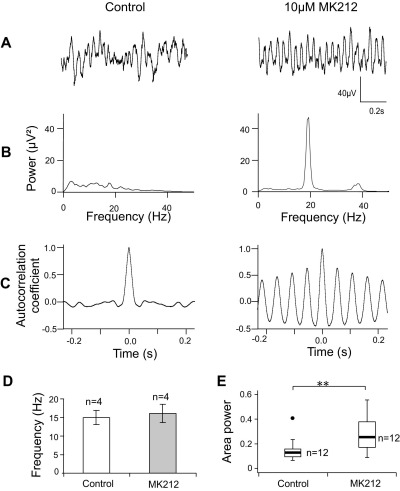
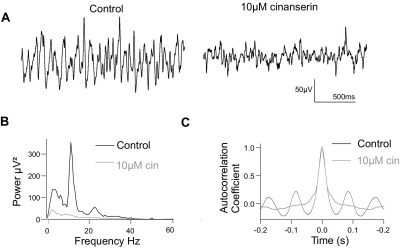
Neuronal networks generating rhythmic activity as an emergent property are common throughout the nervous system. Some are responsible for rhythmic behaviours, as is the case for the spinal cord locomotor networks; however, for others the function is more subtle and usually involves information processing and/or transfer. An example of the latter is sympathetic nerve activity, which is synchronized into rhythmic bursts in vivo. This arrangement is postulated to offer improved control of target organ responses compared to tonic nerve activity. Traditionally, oscillogenic circuits in the brainstem are credited with generating these rhythms, despite evidence for the persistence of some frequencies in spinalized preparations. Here, we show that rhythmic population activity can be recorded from the intermediolateral cell column (IML) of thoracic spinal cord slices. Recorded in slices from 10- to 12-day-old rats, this activity was manifest as 8-22 Hz oscillations in the field potential and was spatially restricted to the IML. Oscillations often occurred spontaneously, but could also be induced by application of 5-HT, α-methyl 5-HT or MK212. These agents also significantly increased the strength of spontaneous oscillations. Rhythmic activity was abolished by TTX and attenuated by application of gap junction blockers or by antagonists of GABA(A) receptors. Together these data indicate that this rhythm is an emergent feature of a population of spinal neurons coupled by gap junctions. This work questions the assumption that sympathetic rhythms are dependent on supraspinal pacemaker circuits, by highlighting a surprisingly strong rhythmogenic capability of the reduced sympathetic networks of the spinal cord slice.


Figures

Fig. 1
Fig. 1
Verification of the experimental set-up for capturing extracellular traces. (A) Typical recording from the IML of a spinal cord slice. Left: extracellular recording. Right: power spectrum of recorded activity with a range of frequencies between 5 and 30 Hz. (B) Placing the electrode in the bathing solution shows the level of background noise. Note the difference in scale. (C) Comparison of extracellular activity recorded in the same slice from three different regions: lamina IX of ventral horn, Lamina II of dorsal horn and the IML. Each trace is accompanied by the autocorrelogram (left) and power spectrum (right). Oscillations were present only in the IML. AC, autocorrelation coefficient. (D) Rhodamine dye at the recording site shows correct positioning in the IML. Images show the same area of spinal cord revealing rhodamine fluorescence (right), or structure of the cord (left). Arrow indicates the dorsolateral border of the IML.
Fig. 2
Fig. 2
IML oscillations are abolished by the Na+ channel blocker TTX. (A) Low-pass filtered (<35 Hz) extracellular recording from the IML of a spinal cord slice. Application of 1 μM TTX reduced the activity in the slice. The trace did not recover upon removal of TTX. Grey regions were subjected to the analyses presented below. A segment of data from each of the grey regions is presented on a faster timescale below to show the oscillation more clearly. (B) Autocorrelograms of the grey regions, showing that the activity was self similar (sinusoidal plot) before, but not after, application of TTX. (C) Power spectra of the grey regions reveal the presence of a rhythm at 13 Hz, and a small harmonic at approximately twice this frequency. Both peaks were abolished by TTX. (D) Surface plot showing a series of power spectra constructed at regular time intervals from the data in (A). TTX first reduced then abolished the main frequency peak over a period of approximately 30 s. (E) Bar chart where frequency was measured at the latest time in the recording that a power spectrum peak could still be observed. Oscillation frequency was not affected by TTX. (F) Box plot shows the median (thick horizontal line), interquartile range (box) and range (T bars) of oscillation power. Filled circle represents an individual outlier. Oscillation power was significantly reduced by TTX (n=6). * P<0.05, Wilcoxon matched pairs signed rank test.).
Fig. 3
Fig. 3
IML oscillations are sensitive to gap junction blockers. (A–C) illustrate a single experiment. (A) Low-pass filtered (<35 Hz) extracellular recordings. The gap junction blocker 18β-glycyrrhetinic acid (100 μM) reduced the amplitude of activity in the IML. (B) Power spectral analysis of the raw traces showing that a 13 Hz oscillation in IML activity was abolished by 18β-glycyrrhetinic acid. (C) The autocorrelogram becomes flattened following gap junction blockade, indicating that the degree of rhythmicity has been reduced by this drug. (D) Bar chart illustrating the change in mean frequency of IML oscillations following treatment with 18β-glycyrrhetinic acid (18β-GA). Error bars show SEM. Oscillation frequency was significantly reduced by this agent. (E) Box plot (as for Fig. 2) of oscillation power before and after application of 18β-glycyrrhetinic acid. The median power was significantly reduced by this drug. (F–H) illustrate a second experiment. (F) Low-pass filtered (<35 Hz) extracellular recordings. The Cx36-selective gap junction blocker mefloquine (1 μM) reduced the amplitude of IML activity. (G) Power spectra of the traces in (D) show that a 19 Hz oscillation in this slice was abolished by mefloquine. (H) Autocorrelograms of the same data segments illustrate that the degree of rhythmicity was reduced by mefloquine. (I) Bar chart showing the effect of mefloquine on the mean frequency of IML oscillations. Error bars show SEM. (J) Box plot showing the distribution of oscillation power before and after mefloquine treatment. There was a trend towards a reduction of both power (J) and frequency (I) by mefloquine but this was not statistically significant. * P<0.05, paired Student's T test (D) or Wilcoxon matched pairs signed ranks test (E).
Fig. 4
Fig. 4
Blockade of GABAA receptors with bicuculline attenuates IML oscillations. (A) Extracellular oscillations are present in control conditions but are reduced by 10 μM bicuculline. (B) Power spectra of extracellular activity. A large 10 Hz peak is present in control conditions, but is reduced after treatment with bicuculline. (C) Autocorrelograms of the same segment of data analysed in (B). The activity is less strongly correlated following treatment with bicuculline. (D) Surface plot of oscillation power over time showing the time course of inhibition of oscillations by bicuculline and the subsequent recovery upon removal of the drug.
Fig. 5
Fig. 5
5-HT induces oscillatory activity in the IML. (A) Low-pass filtered (<35 Hz) extracellular voltage recording from the IML of a single spinal cord slice before (left) and after (right) application of 10 μM 5-HT. Rhythmic oscillations appear during 5-HT application. (B) Power spectral analysis of a 1 min segment of control (left) and 5-HT (right) activity showing a prominent peak at 9.4 Hz. (C) Autocorrelograms showing that the activity is self-similar (rhythmic) only after 5-HT is applied. (D) Surface plot of power spectra taken at consecutive time points from a different slice, showing the development and decline of an 11.9 Hz oscillation over time. (E) Bar chart of the mean data showing that the mean oscillation frequency was not affected by 5-HT (n=5). Error bars=SEM. (F) Box plot of oscillation power (as for Fig. 2). 10 μM 5-HT significantly increased the power of the oscillation. * P<0.05, Wilcoxon matched pairs signed rank test.
Fig. 6
Fig. 6
The 5-HT2 agonist αme5-HT increases rhythmic activity in the IML. (A) Voltage recordings from the IML showing effects of 10 μM αme5-HT. (B) Power spectra of the activity in (A) showing the presence of a peak at 13.1 Hz only after addition of αme5-HT. (C) Autocorrelograms showing that the activity is self-similar after αme5-HT. (D) Bar chart showing that the mean frequency of IML oscillations was not affected by αme5-HT (n=6). (E) Box plot (as Fig. 2) showing that oscillation power was significantly increased by αme5-HT (n=12). ** P<0.01, Wilcoxon matched pairs signed rank test.
Fig. 7
Fig. 7
The 5-HT2C agonist MK212 induces oscillatory activity in the IML. (A) Extracellular recordings where activity becomes oscillatory following 10 μM MK212. (B) Power spectra of the activity traces in (A) with a large peak at around 20 Hz and a smaller harmonic peak at twice the frequency. (C) Autocorrelograms of same activity. (D) Bar chart shows the lack of effect of MK212 on the frequency of the ongoing activity (n=4). (E) Box plot (as Fig. 2) showing that MK212 significantly increased the power of IML oscillations (n=13). ** P=0.006, Wilcoxon matched pairs signed rank test.
Fig. 8
Fig. 8
Spontaneous IML oscillations were reduced by the 5-HT antagonist cinanserin. (A) Extracellular recording from the IML where rhythmic spontaneous oscillations were reduced by 10 μM cinanserin. (B) Power spectra of the activity in (A) showing the peak in the power is reduced by cinanserin. (C) Autocorrelograms of activity, showing that the activity was self similar (sinusoidal plot) before, but not after, application of cinanserin.

Similar articles

Cited by

References

    1. Allen A.M., Adams J.M., Guyenet P.G. Role of the spinal cord in generating the 2- to 6-Hz rhythm in rat sympathetic outflow. Am J Physiol. 1993;264:R938–R945. - PubMed
    1. Asghar A.U., Cilia La Corte P.F., LeBeau F.E., Al Dawoud M., Reilly S.C., Buhl E.H., Whittington M.A., King A.E. Oscillatory activity within rat substantia gelatinosa in vitro: a role for chemical and electrical neurotransmission. J Physiol. 2005;562:183–198. - PMC - PubMed
    1. Barman S.M., Gebber G.L. “Rapid” rhythmic discharges of sympathetic nerves: sources, mechanisms of generation, and physiological relevance. J Biol Rhythms. 2000;15(5):365–379. - PubMed
    1. Buhl D.L., Harris K.D., Hormuzdi S.G., Monyer H., Buzsaki G. Selective impairment of hippocampal gamma oscillations in connexin-36 knock-out mouse in vivo. J Neurosci. 2003;23:1013–1018. - PMC - PubMed
    1. Cobb S.R., Buhl E.H., Halasy K., Paulsen O., Somogyi P. Synchronization of neuronal activity in hippocampus by individual GABAergic interneurons. Nature. 1995;378:75–78. - PubMed

Publication types

MeSH terms