. 2010 Jul 24;376(9737):268-84.
doi: 10.1016/S0140-6736(10)60743-X.

HIV and risk environment for injecting drug users: the past, present, and future

Affiliations

HIV and risk environment for injecting drug users: the past, present, and future

Steffanie A Strathdee et al. Lancet. .

Abstract

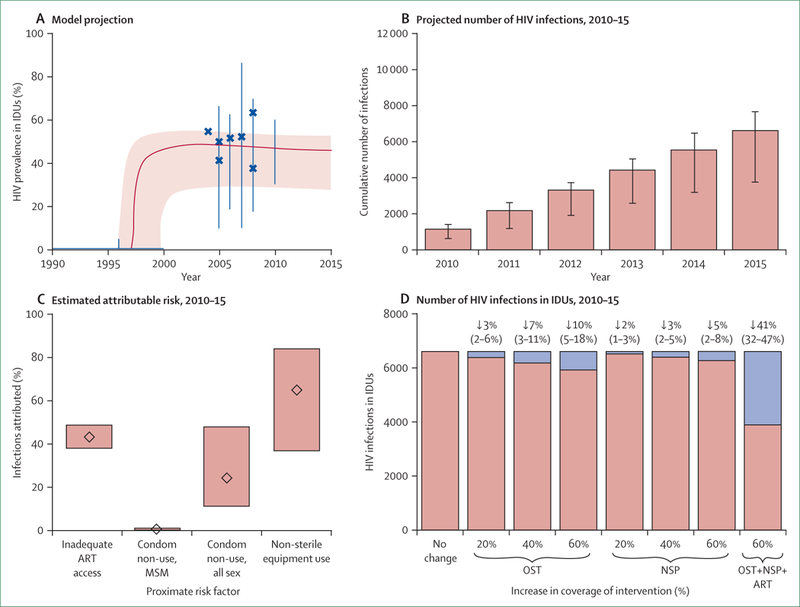
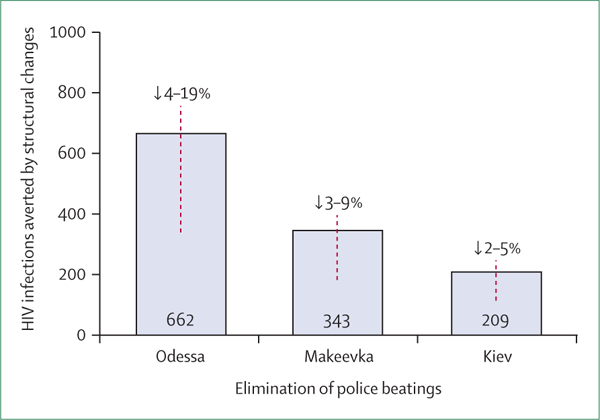
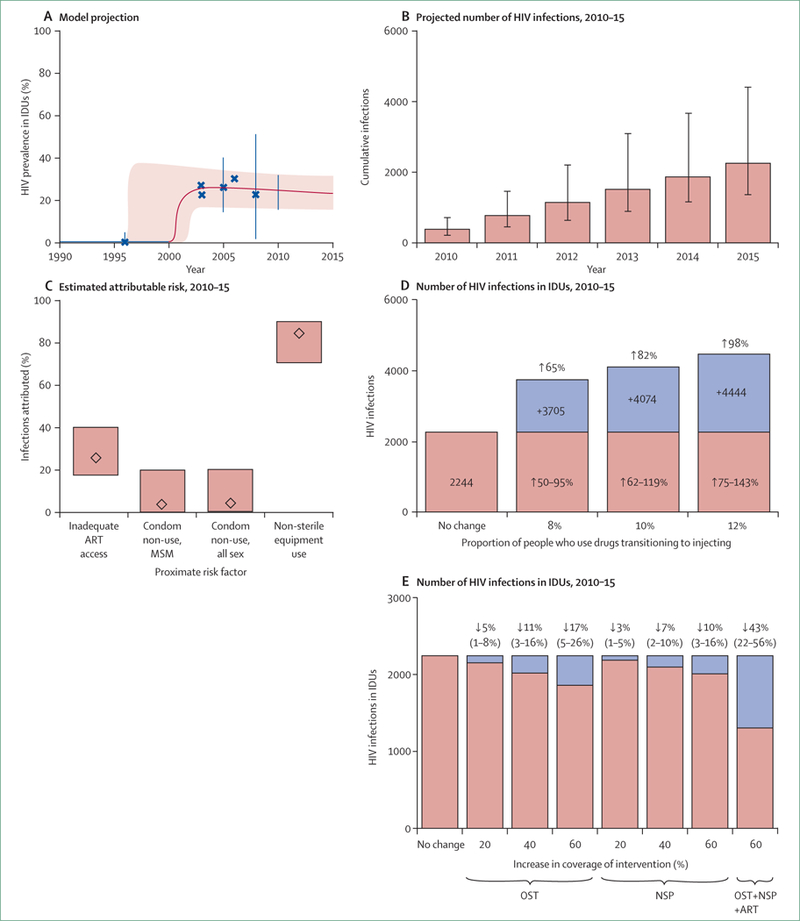
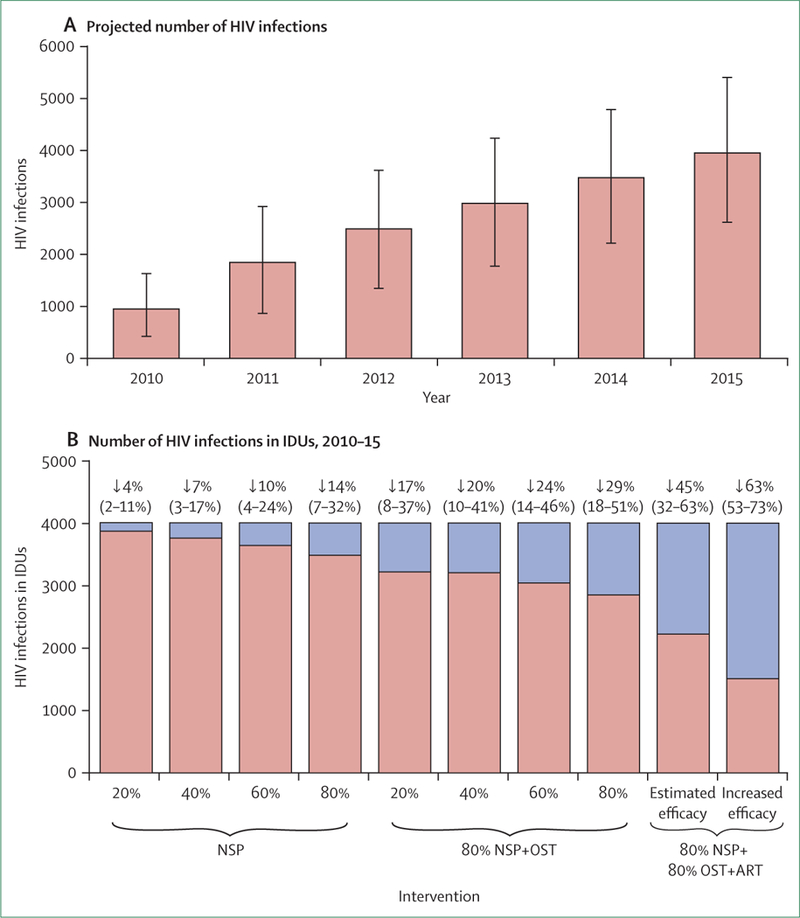
We systematically reviewed reports about determinants of HIV infection in injecting drug users from 2000 to 2009, classifying findings by type of environmental influence. We then modelled changes in risk environments in regions with severe HIV epidemics associated with injecting drug use. Of 94 studies identified, 25 intentionally examined risk environments. Modelling of HIV epidemics showed substantial heterogeneity in the number of HIV infections that are attributed to injecting drug use and unprotected sex. We estimate that, during 2010-15, HIV prevalence could be reduced by 41% in Odessa (Ukraine), 43% in Karachi (Pakistan), and 30% in Nairobi (Kenya) through a 60% reduction of the unmet need of programmes for opioid substitution, needle exchange, and antiretroviral therapy. Mitigation of patient transition to injecting drugs from non-injecting forms could avert a 98% increase in HIV infections in Karachi; whereas elimination of laws prohibiting opioid substitution with concomitant scale-up could prevent 14% of HIV infections in Nairobi. Optimisation of effectiveness and coverage of interventions is crucial for regions with rapidly growing epidemics. Delineation of environmental risk factors provides a crucial insight into HIV prevention. Evidence-informed, rights-based, combination interventions protecting IDUs' access to HIV prevention and treatment could substantially curtail HIV epidemics.


Conflict of interest statement

Conflicts of interest

We declare that we have no conflicts of interest.

Figures

Figure 1:
Figure 1:. HIV risk factors in injecting drug users
The HIV risk environment is a product of action produced by the continuing, interlocking, and synergistic effects of exogenous and endogenous factors over time. Developed from Glass and McAtee. STI=sexually transmitted infection. HBV=hepatitis B virus. HCV=hepatitis C virus.
Figure 2:
Figure 2:. Routes of HIV transmission among populations of IDUs
Population subgroups and risk of HIV infection from shared use of injection equipment (green arrows) and sex (red arrows) are shown. Dashed arrows show entry and exit to the injecting drug user population (ie, start or stop of drug injections). IDU=injecting drug users.
Figure 3:
Figure 3:. Model projections for the HIV epidemic in IDUs in Odessa, Ukraine
(A) HIV prevalence in IDUs, 1990–2015. Blue crosses show prevalence estimates from data; solid black lines show limits placed on HIV prevalence; pink area shows envelope of posterior model fits; and the thick red line shows the epidemic projection for the best-fitting model (for details of model and fitting procedure see webappendix pp 1–40). (B) Projected number of HIV infections every year for 2010–15 in the IDU population, assuming no further changes in patterns of risk (bars show best-fit estimate and vertical lines show 90% credible interval). (C) Estimates of the attributable risk of selected proximate risk factors for the IDU population. Estimates are the proportion of infections that would be averted in the absence of the risk factor, which is estimated as the proportion of projected infections that would be averted if that risk were absent from 2010–15; width of bar shows 95% credible interval and diamond shows median. Attributable risks do not sum to 100%. (D) Projected change in the number of HIV infections in Odessa (2010–15) and assuming increased coverage of OST, NSP, and ART by 20%, 40%, or 60%. Numbers (95% credible interval) are percentages of infections averted (shown in blue). Access to OST and NSP are assumed to reduce the rate of overall exposure to non-sterile injecting equipment by half, and present levels of access to interventions (table 1) are taken into account. IDUs=injecting drug users. ART=antiretroviral therapy. MSM=men who have sex only with men. OST=opioid substitution therapy. NSP=needle and syringe programme.
Figure 4:
Figure 4:. Estimated number of HIV infections averted by structural changes
Projected number (95% credible interval of percentage reduction) of infections that could be averted after elimination of police beatings in Odessa, Makeevka, and Kiev. Estimations made on the basis of reported correlations between exposure to non-sterile injecting equipment and experience of beatings in the three Ukrainian cities (see webappendix p 10).
Figure 5:
Figure 5:. Model projections for the HIV epidemic in IDUs in Karachi, Pakistan
(A) HIV prevalence in IDUs, 1990–2015. Blue crosses show prevalence estimates from data; solid black lines show limits placed on HIV prevalence; pink area shows envelope of posterior model fits; and the thick red line shows the epidemic projection for the best-fitting model (for details of model and fitting procedure see webappendix pp 1–40). (B) Projected number of HIV infections every year for 2010–15 in the IDU population, assuming no further changes in patterns of risk (bars show best-fit estimate and vertical lines show 95% credible interval). (C) Estimates of the attributable risk of selected proximate risk factors for the IDU population. Estimates are the proportion of infections that would be averted in the absence of the risk factor, which is estimated as the proportion of projected infections that would be averted if that risk were absent from 2010–15; width of bar shows 95% credible interval and diamond shows median. Attributable risks do not sum to 100%. (D) Projected number of infections in the IDU population during 2010–15, assuming that 8%, 10%, or 12% of people who use non-injecting drugs transition to injecting drugs in 2010. (for the model structure and variables see webappendix pp 1–40). (E) Projected change in the number of HIV infections in Karachi (2010–15) and assuming increased coverage of OST, NSP, and ART by 20%, 40%, or 60%. Numbers (95% credible interval) are percentages of infections averted (shown in blue). Access to OST and NSPs are assumed to reduce the rate of overall exposure to non-sterile injecting equipment by half, and present levels of access to interventions (table 2) are taken into account. IDUs=injecting drug users. ART=antiretroviral therapy. MSM=men who have sex only with men. OST=opioid substitution therapy. NSP=needle and syringe programme.
Figure 6:
Figure 6:. Model projections of the HIV epidemic in IDUs in Nairobi, Kenya
(A) Expected number of HIV infections (with 95% uncertainty interval) in IDUs in Nairobi, 2010–15. (B) Estimated effect of interventions on the total number of infections in IDUs, 2010–15. Red parts of the bars are proportion of infections averted relative to a no-intervention scenario. Interventions are 20%, 40%, 60%, or 80% coverage of NSPs; 80% coverage of NSPs plus 20%, 40%, 60%, or 80% coverage of OST; 80% coverage of NSPs and OST plus 80% coverage of antiretroviral therapy (initiated at CD4 count of 350 cells per μL) to those in need; and 80% coverage of NSTs and OST at a higher effectiveness (70%) and ART. IDUs=injecting drug users. NSP=needle and syringe programme. OST=opioid substitution therapy. ART=antiretroviral therapy.

Comment in

  • Alcohol: the forgotten drug in HIV/AIDS.
    Fritz K, Morojele N, Kalichman S. Fritz K, et al. Lancet. 2010 Aug 7;376(9739):398-400. doi: 10.1016/S0140-6736(10)60884-7. Lancet. 2010. PMID: 20650516 Free PMC article. No abstract available.

Similar articles

Cited by

References

    1. Mathers BM, Degenhardt L, Phillips B, et al. Global epidemiology of injecting drug use and HIV among people who inject drugs: a systematic review. Lancet 2008; 372: 1733–45. - PubMed
    1. Santibanez SS, Garfein RS, Swartzendruber A, Purcell DW, Paxton LA, Greenberg AE. Update and overview of practical epidemiologic aspects of HIV/AIDS among injection drug users in the United States. J Urban Health 2006; 83: 86–100. - PMC - PubMed
    1. Latkin CA, Forman V, Knowlton A, Sherman S. Norms, social networks, and HIV-related risk behaviors among urban disadvantaged drug users. Soc Sci Med 2003; 56: 465–76. - PubMed
    1. Des Jarlais DC, Arasteh K, Perlis T, et al. Convergence of HIV seroprevalence among injecting and non-injecting drug users in New York City. AIDS 2007; 21: 231–35. - PubMed
    1. Booth RE, Kwiatkowski CF, Brewster JT, Sinitsyna L, Dvoryak S. Predictors of HIV sero-status among drug injectors at three Ukraine sites. AIDS 2006; 20: 2217–23. - PubMed

Publication types