. 2010 Oct 1;285(40):30741-51.
doi: 10.1074/jbc.M110.105700. Epub 2010 Jul 22.

Loss of beta1-integrin enhances TGF-beta1-induced collagen expression in epithelial cells via increased alphavbeta3-integrin and Rac1 activity

Affiliations

Loss of beta1-integrin enhances TGF-beta1-induced collagen expression in epithelial cells via increased alphavbeta3-integrin and Rac1 activity

Tomoko Hayashida et al. J Biol Chem. .

Abstract

Transforming growth factor β (TGF-β) promotes tissue fibrosis via the receptor-specific Smad pathway and non-canonical pathways. We recently reported that TGF-β1-stimulated collagen expression by cultured kidney cells requires integrin-dependent activation of focal adhesion kinase (FAK) and consequent ERK MAP kinase activity leading to Smad3 linker region phosphorylation. Here, we defined a role for αvβ3-integrin in this non-canonical pathway. A human kidney tubular cell line in which β1-integrin was knocked down (β1-k/d) demonstrated enhanced type I collagen mRNA expression and promoter activity. A second shRNA to either αv-integrin or β3-integrin, but not to another αv-binding partner, β6-integrin, abrogated the enhanced COL1A2 promoter activity in β1-k/d cells. Although αvβ3-integrin surface expression levels were not different, αvβ3-integrins colocalized with sites of focal adhesion significantly more in β1-k/d cells, and activated αvβ3-integrin was detected only in β1-k/d cells. Further, the collagen response was decreased by a function-blocking antibody or a peptide inhibitor of αvβ3-integrin. In cells lacking αvβ3-integrin, the responses were attenuated, whereas the response was enhanced in αvβ3-overexpressing cells. Rac1 and ERK, previously defined mediators for this non-canonical pathway, showed increased activities in β1-k/d cells. Finally, inhibition of αvβ3-integrin decreased Rac1 activity and COL1A2 promoter activity in β1-k/d cells. Together, our results indicate that decreasing β1 chain causes αvβ3-integrin to become functionally dominant and promotes renal cell fibrogenesis via Rac1-mediated ERK activity.


Figures
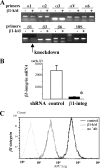
FIGURE 1.
FIGURE 1.
Specific knockdown of integrins by lentiviral shRNA in HKC cells. Representative results comparing β1-k/d and control cells are shown. Similar specific results were confirmed for knockdowns of α1-, α3, αv, β3, and β6-integrins. A, integrin mRNA and 18 S expressions evaluated by semiquantitative RT-PCR. B, β1-integrin (β1-integ) mRNA levels measured by real-time quantitative PCR. Mean ± S.E. from a representative experiment from three independent assays performed in triplicate is shown. *, p < 0.01 as compared with control β1-integ, β1-integrin. C, effects of shRNA on the surface expression of β1-integrin were confirmed by flow cytometry of either β1-k/d cells (dark gray line) or control cells (black line). The light gray line represents negative control incubated with APC-conjugated secondary antibody without primary antibody (no ° Ab).
FIGURE 2.
FIGURE 2.
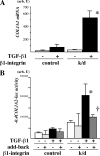
Effects of β1-integrin k/d on TGF-β1 stimulation of type I collagen production in HKC cells. A, COL1A1 mRNA levels evaluated by qPCR. Data are shown from a representative reaction run in triplicates. *, p < 0.01 for effects of knockdown. arb. U, arbitrary units. B, -0.4COL1A2 promoter activity induced by TGF-β1 in the presence of either a β1-integrin expression vector or an empty vector was examined in β1-k/d or control cells. The luciferase activity assayed in triplicates was standardized for β1-galactosidase expression to control for transfection efficiency. A set of representative data (mean ± S.E.) from three independent experiments is shown. *, p < 0.01 for effects of the knockdown, †, p < 0.01 for effects of β1-integrin add-back. arb. U, arbitrary units.
FIGURE 3.
FIGURE 3.
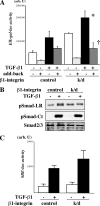
Effects of β1-integin k/d on ERK and Smad activities. A and C, effects of β1-integrin k/d on ERK MAP kinase activity (A) and SBE-luc activity (C) induced by TGF-β1 for 24 h. β1-integrin was transiently re-expressed in β1-k/d or control HKC cells along with Elk-gal-luc reporters where indicated (add-back). Representative data (mean ± S.E.) of triplicates from one of three independent experiments are shown. *, p < 0.01 for effects of the knockdown, †, p < 0.01 for effects of β1-integrin add-back. arb. U, arbitrary units. B, Smad phosphorylation (pSmad) at either the linker region (LR)-regulated or the receptor-regulated C-terminal (Ct) after 30 min of TGF-β1 treatment or a vehicle in β1-k/d or control HKC cells was detected by immunoblots with phospho-specific antibodies. Equivalent Smad expression was verified with immunoblot with whole cell lysates (bottom panel).
FIGURE 4.
FIGURE 4.
Effects of inducible shRNA to β1-integrin on collagen promoter, SBE-luc, and Elk-gal-luc reporter activities. HKC cells stably expressing a doxycycline (DOX)-inducible TRIPZ-β1-integrin shRNA were cultured in the presence of doxycycline (0.5 μg/ml) or a vehicle for 2 days prior to transfection of the reporter constructs followed by reporter assays with 24-h TGF-β1 treatment. Each condition was assayed in triplicate, and data (mean ± S.E.) from one of three independent experiments are shown. *, p < 0.05 for effects of the shRNA induction. arb. U, arbitrary units.
FIGURE 5.
FIGURE 5.
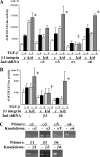
Identification of integrins that contribute to the enhanced collagen response in β1-k/d cells. Vectors that express shRNA to various α-chains (A) or β-chains (B) were transiently expressed in β1-k/d or control HKC cells, along with a -0.4COL1A2-luc reporter construct and β1-galactosidase expression vector, and luciferase activity was evaluated after a 24-h TGF-β1 treatment. Each bar represents a mean ± S.E. of samples in triplicate, and results from one of three separate experiments are shown. *, p < 0.01 for effects of β1-k/d and †, p < 0.01 for effects of additional shRNA as compared with those expressing negative control shRNA. arb. U, arbitrary units. C, effects of knockdown by shRNA to specific integrins in HKC cells evaluated by semiquantitative PCR are shown.
FIGURE 6.
FIGURE 6.
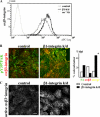
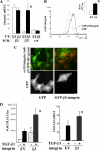
Activation of αvβ3-integrins in β1-k/d cells. A, Surface expression of αvβ3-integrin in β1-k/d or control HKC cells was evaluated by flow cytometry with a monoclonal antibody to αvβ3. no ° Ab indicates without primary antibody. B, β1-k/d or control HKC cells plated on gelatin-coated coverslip were stained following fixation/permeabilization with antibodies to αvβ3-integrin (red) and to phospho-Tyr-397 FAK (green). Signal from Marine blue (blue) was pseudo colored to green by image acquisition software (LSM image analyzer) for better visualization. Colocalization of these molecules was depicted as yellow in the merged images, as well as in the graphical representation of analysis using the CoLocalizer Express software. *, p < 0.05 as compared with control. dpi, dot per inch. C, specific staining with WOW1 antibody that recognizes active αvβ3-integrin was detected with a secondary antibody conjugated with Alexa Fluor 568. Bar = 10 μm. 63×/1.4× oil objective.
FIGURE 7.
FIGURE 7.
Effects of αvβ3-integrin inhibition on the collagen response in β1-k/d cells. A, collagen expression by a 24-h TGF-β1 treatment in the presence of a function-blocking antibody to αvβ3-integrin (LM609, 10 μg/ml) in β1-k/d or control HKC cells was assessed at either promoter (left panel) or mRNA (right panel) levels. arb. U, arbitrary units. B, similar effects were observed with another αvβ3-integrin inhibitor, cyclic RGD (XJ735, 20 μm). Each condition was run in triplicates, and data (mean ± S.E.) from representative experiments that were performed at least three times are shown. *, p < 0.01 for effects of knockdown as compared with control cells. †, p < 0.05 for effects of inhibitors as compared with β1-k/d without the inhibitor.
FIGURE 8.
FIGURE 8.
Collagen responses in β3-integrin-null cells in the presence of β1-integrin. A, relative mRNA expression levels for β1-, β3-, and αv-integrins in CT26 cells (solid bars) or NIH 3T3 cells as control (open bars) were analyzed by qPCR. Mean ± S.E. of triplicated measurement is shown. An inset is shown for β3-integrin, expression of which is generally significantly lower, yet it shows differences between the two cell lines. B, mRNA levels for COL1A2 in CT26 or NIH3T3 cells treated with TGF-β1 for 24 h were analyzed by qPCR. Data from one of three separate experiments are shown. *, p < 0.01 for effects of β3-integrin-null CT26 cells as compared with control 3T3 fibroblasts.
FIGURE 9.
FIGURE 9.
Effects of β3-integrin overexpression on αvβ3-integrin and collagen responses. A, mRNA expression levels for β1-, β3-, and αv-integrin were evaluated by qPCR in HKC cells transiently transfected with an expression vector for β3-integrin or its control. Representative sets of data run in triplicates are shown from two independent assays. *, p < 0.01 as compared with control. T/F, transfection. B, HKC cells transfected with either GFP-integrin or GFP-β3-integrin empty vector (EV) were sorted for GFP, and αvβ3-integrin expression was evaluated with flow cytometry. A representative result is shown, along with mean ± S.E. of mean intensity, shown as incept. *, p < 0.05 as compared with control (n = 4). C, HKC cells plated on gelatin-coated glass coverslips were transfected with GFP- or GFP-β3-integrin expression vector for 24 h and then fixed/permeabilized and stained for αvβ3-integrin (red) and phospho-Tyr-397 FAK (green). Representative merged images (top panels) along with corresponding images for GFP expression are shown. The original blue staining for phospho-Tyr-397 FAK due to the presence of GFP was pseudo colored to green with image acquisition software for better representation, and images for GFP are shown in black and white, accordingly. D, HKC cells were transiently transfected with an expression vector for β3-integrin or its control, and -0.4COL1A2-luc promoter activity (left panel) or COL1A1 mRNA expression (right panel) after 24-h TGF-β1 treatment was evaluated. Each bar represents a mean ± S.E. of samples in triplicate, and representative results from one of three separate experiments are shown. *, p < 0.05 for effects of β3-integrin overexpression. arb. U, arbitrary units.
FIGURE 10.
FIGURE 10.
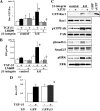
Rac1 activity in β1-k/d cells and its role in the enhanced ERK and collagen promoter activity. A, cell lysates of β1-k/d or control HKC cells treated with TGF-β1 or vehicle for 15 min were subjected to a pulldown assay, and the GTP-bound form of Rac1 was detected by immunoblotting with antibody to Rac1 (upper panel). A 5-min treatment with EGF shows that cells are capable of activating Rac1 given a known stimulus. Lysates incubated with GDP or non-hydrolyzable GTPγS are shown as negative or positive control, respectively. Equal input of Rac1 protein was verified with whole cell lysates (bottom panel). B, Rac1 activation in TRIPZ-β1-k/d cells was evaluated with increasing duration of doxycycline (DOX) treatment that induces shRNA to β1-integrin in HKC cells. C, Rac1 cellular localization was evaluated with β1-k/d or control HKC cells plated on gelatin-coated glass coverslips and stained with an antibody to Rac1. Membrane localization of the protein is depicted with arrows. Bar = 10 μm. 63× oil objective. D, a Rac1 or negative control shRNA expression vector was transiently transfected in either β1-k/d or control cells along with either Elk-Gal-luc reporter system (left) or -0.4COL1A2-luc construct (right). Reporter activities after a 24-h treatment with TGF-β1 or vehicle were assayed in triplicate, and data from one of three independent experiments are shown as mean ± S.E. of luciferase readings corrected for β1-galactosidase expression. *, p < 0.01 for effects of the knockdown as compared with control cells, †, p < 0.05 for effects of inhibitors as compared with β1-k/d without the shRNA. arb. U, arbitrary units.
FIGURE 11.
FIGURE 11.
Role for αvβ3-integrin in Rac1 activity. A, β1-k/d or control cells were pretreated with an αvβ3-integrin inhibitor, LM609 (10 μg/ml), for 1 h and then treated with TGF-β1 or vehicle for 15 min. GTP-bound, active Rac1 was detected by a pulldown assay, and the resulting immunoreactive bands were scanned and analyzed by NIH ImageJ software. Mean ± S.E. of three separate experiments is shown. *, p < 0.05 for effects of the knockdown, †, p < 0.05 for effects of the inhibitors. arb. U, arbitrary units. B, β1-k/d or control HKC cells expressing the Elk-Gal-luc promoter construct, along with β-galactosidase expression vector, were treated with LM609 (10 μg/ml) for 1 h followed by a 24-h incubation with TGF-β1. Resulting luciferase activity, mean ± S.E. of triplicates, after standardization with β1-galactosidase expression is shown. *, p < 0.05 for effects of knockdown, †, p < 0.05 for effects of the inhibitors. C, either β1-k/d or control cells that were treated with another αvβ3-integrin inhibitor, XJ735 (20 μm), for 1 h and lysates were analyzed by immunoblotting with indicated antibodies. Representative blots from at least three separate experiments are shown. p indicates phosphorylation. D, HKC cells transfected with either GFP-integrin or GFP-β3-integrin expression vector were sorted for GFP and replated for Rac assay. Rac activity after treatment with TGF-β1 or vehicle for 15 min was evaluated by Rac G-LISA assay. Mean ± S.E. (n = 3) of relative change from control cells is shown. *, p < 0.05 as compared with GFP-expressing control cells treated with vehicle. T/F, transfection.

Similar articles

Cited by

References

    1. Blobe G. C., Schiemann W. P., Lodish H. F. (2000) N. Engl. J. Med. 342, 1350–1358 - PubMed
    1. Schmierer B., Hill C. S. (2007) Nat. Rev. Mol. Cell Biol. 8, 970–982 - PubMed
    1. Wrighton K. H., Lin X., Feng X. H. (2009) Cell Res. 19, 8–20 - PMC - PubMed
    1. Moustakas A., Heldin C. H. (2005) J. Cell Sci. 118, 3573–3584 - PubMed
    1. Schnaper H. W., Hayashida T., Hubchak S. C., Poncelet A. C. (2003) Am. J. Physiol. Renal Physiol. 284, F243–F252 - PubMed

Publication types

MeSH terms