. 2010 Sep 24;285(39):30091-102.
doi: 10.1074/jbc.M109.066464. Epub 2010 Jul 22.

Identification of direct and indirect effectors of the transient receptor potential melastatin 2 (TRPM2) cation channel

Affiliations

Identification of direct and indirect effectors of the transient receptor potential melastatin 2 (TRPM2) cation channel

Balázs Tóth et al. J Biol Chem. .

Abstract

Transient receptor potential melastatin 2 (TRPM2) is a Ca(2+)-permeable cation channel involved in physiological and pathophysiological processes linked to oxidative stress. TRPM2 channels are co-activated by intracellular Ca(2+) and ADP-ribose (ADPR) but also modulated in intact cells by several additional factors. Superfusion of TRPM2-expressing cells with H(2)O(2) or intracellular dialysis of cyclic ADPR (cADPR) or nicotinic acid adenine dinucleotide phosphate (NAADP) activates, whereas dialysis of AMP inhibits, TRPM2 whole-cell currents. Additionally, H(2)O(2), cADPR, and NAADP enhance ADPR sensitivity of TRPM2 currents in intact cells. Because in whole-cell recordings the entire cellular machinery for nucleotide and Ca(2+) homeostasis is intact, modulators might affect TRPM2 activity either directly, by binding to TRPM2, or indirectly, by altering the local concentrations of the primary ligands ADPR and Ca(2+). To identify direct modulators of TRPM2, we have studied the effects of H(2)O(2), AMP, cADPR, NAADP, and nicotinic acid adenine dinucleotide in inside-out patches from Xenopus oocytes expressing human TRPM2, by directly exposing the cytosolic faces of the patches to these compounds. H(2)O(2) (1 mM) and enzymatically purified cADPR (10 μM) failed to activate, whereas AMP (200 μM) failed to inhibit TRPM2 currents. NAADP was a partial agonist (maximal efficacy, ∼50%), and nicotinic acid adenine dinucleotide was a full agonist, but both had very low affinities (K(0.5) = 104 and 35 μM). H(2)O(2), cADPR, and NAADP did not enhance activation by ADPR. Considering intracellular concentrations of these compounds, none of them are likely to directly affect the TRPM2 channel protein in a physiological context.


Figures

FIGURE 1.
FIGURE 1.
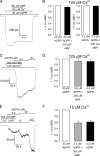
Apparent affinity of TRPM2 for ADPR at saturating and subsaturating [Ca2+]i. A and B, inward currents at −20 mV in two inside-out patches excised from Xenopus oocytes injected with TRPM2 cRNA, elicited by increasing concentrations of ADPR (bars). Intracellular [Ca2+] was 125 μm in A and 15 μm in B. C, normalized dose-response curves for fractional activation by ADPR in the presence of a constant [Ca2+]i of either 125 μm (black circles) or 15 μm (white circles). For both curves, the currents were corrected for the rundown (see “Experimental Procedures” and Fig. S1) and normalized to the maximal current obtained in the same patch in the presence of 32 μm ADPR and 125 or 15 μm [Ca2+], respectively. In the case of 125 μm Ca2+, this maximal current corresponds to an open probability of close to unity (9), whereas in 15 μm Ca2+ maximal open probability is ∼0.2–0.5 (9) (Figs. 1D, 2C, and 3E). The error bars represent S.E. Lines represent fits to the Hill equation; predicted midpoints are printed in the panel, Hill coefficients were nH = 2.0 ± 0.2 for 125 μm Ca2+ and nH = 1.1 ± 0.2 for 15 μm Ca2+. D, fractional current activation by 15 μm Ca2+ in the presence of 32 μm ADPR is not enhanced by the presence of 2 μm calmodulin (CAM). E, fractional TRPM2 currents activated by 32 μm ADPR in 4 or 15 μm Ca2+ in the absence (black bars) and presence (gray bars) of 2 μm calmodulin. The currents were corrected for rundown as described in supplemental Fig. S1 and normalized to those elicited in the same patch by 32 μm ADPR + 125 μm Ca2+ (white bar). The error bars represent S.E. F, in the presence of 1 μm Ca2+, negligible fractional currents are activated even by 1000 μm ADPR co-applied with 2 μm calmodulin (CAM); the inset shows unitary channel openings in 1 μm Ca2+ at an expanded current scale.
FIGURE 2.
FIGURE 2.
H2O2 does not directly affect TRPM2 activity. A, macroscopic current responses of TRPM2 channels in inside-out patches to direct superfusion with H2O2. Left panel, no current is activated by direct superfusion with 1 mm H2O2 in the presence of saturating (125 μm) Ca2+ (bars), whereas subsequent exposure to 32 μm ADPR elicits a large current indicating ∼700 active TRPM2 channels in this patch. Right panel, direct superfusion with 1 mm H2O2 does not affect TRPM2 currents activated by 32 μm ADPR in the presence of saturating Ca2+. B, fractional activation by 0, 0.1, 1, and 32 μm ADPR in the presence of 125 μm Ca2+ and 1 mm H2O2. Currents in 1 mm H2O2 + various concentrations of ADPR (black bars) were normalized to those obtained in the same patch by subsequent exposure to 32 μm ADPR (white bar). C, no current is activated by direct superfusion with 1 mm H2O2 in the presence of subsaturating (15 μm) Ca2+ (bars), and fractional current activation by subsequent exposure to increasing concentrations of ADPR in 15 μm Ca2+ is not affected by the maintained presence of 1 mm H2O2. D, fractional activation by 0, 0.1, and 1 μm ADPR in the presence of 15 μm Ca2+ and 1 mm H2O2. Currents in 1 mm H2O2 + various concentrations of ADPR (black bars) were normalized to that obtained in the same patch by subsequent exposure to 32 μm ADPR (white bar). The currents were corrected for rundown (see “Experimental Procedures” and Fig. S1); error bars in B and D represent S.E.
FIGURE 3.
FIGURE 3.
AMP does not inhibit TRPM2 currents in cell-free patches. A, macroscopic TRPM2 current is activated in an inside-out patch by 32 μm ADPR + Ca2+ (bars); 100 μm AMP is added to test for possible inhibition. B, fractional inhibition of ADPR-activated currents by AMP. Currents in the presence of indicated concentrations of AMP + ADPR (black bars) were normalized to the average of the currents in bracketing control segments of record obtained in just ADPR (white bars). C and E, pre-exposure to, and maintained presence of, 200 μm AMP does not prevent stimulation of TRPM2 currents by subsequent addition of 3.2 μm ADPR in either saturating (125 μm, C) or subsaturating (15 μm, E) Ca2+. D and F, currents elicited in the maintained presence of 200 μm AMP by subsequent addition of 3.2 μm ADPR (gray bars) and those obtained in 3.2 μm ADPR following removal of AMP (black bars) were normalized to the currents activated by 32 μm ADPR in the same patch (white bars); [Ca2+]i was 125 μm in D and 15 μm in F. Correction for rundown was done as described for supplemental Fig. S1. The error bars in B, D, and F represent S.E.
FIGURE 4.
FIGURE 4.
Effects of commercial cADPR on TRPM2 currents. A, exposure of an inside-out patch to 10 μm commercial cADPR, in the presence of saturating (125 μm) Ca2+, activates a large TRPM2 current, which is little enhanced by the addition of 10 μm ADPR (bars). B, dose-response curve for fractional activation by commercial cADPR. Currents activated by 0.1, 1, and 10 μm commercial cADPR were normalized to that obtained in the same patch by subsequent addition of saturating (10 μm) ADPR. The rightmost symbol (marked by *) illustrates the maximal current in the presence of 10 μm ADPR and corresponds to an open probability close to unity (9). The solid line is a fit to the Hill equation; fit parameters are indicated in the panel. C, TRPM2 currents are activated by 1 μm commercial cADPR in the presence of saturating Ca2+, followed by the addition of increasing concentrations of ADPR. D, fractional activation by ADPR in the presence of 1 μm commercial cADPR. The currents were normalized to that obtained in the presence of 10 μm ADPR in the same patch. The leftmost symbol (marked by *) denotes fractional current activated by 1 μm commercial cADPR on its own. The solid line is a fit to a modified Hill equation of the form I([ADPR]) = Io + (IIo)*([ADPR]n/(Kn + [ADPR]n)); fit parameters are indicated in the panel.
FIGURE 5.
FIGURE 5.
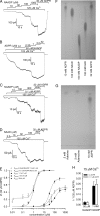
Testing of the cADPR purification procedure. A, TLC analysis of (from left to right) AMP, enzymatically purified cADPR, ADPR, and nontreated cADPR. For all samples 20 nmol of nucleotide were loaded, followed by drying. Note conversion of the ADPR contamination of nontreated cADPR into AMP in the enzymatically purified cADPR sample. B–D, activation of TRPM2 currents by 1 μm ADPR solutions containing an aliquot of nucleotide pyrophosphatase filtrate and by pure 1 μm ADPR (bars). 10- and 3-kDa molecular mass cut-off filter columns were used to produce the filtrates for the experiments in B and C, respectively. For the experiment in D, the filtrate was produced by sequential passages through two 3-kDa molecular mass cut-off filter columns. Approximate timing of the start of each experiment relative to addition of the filtrate to the test solution is indicated above each panel. E, fractional current activated by test solutions containing 1 μm ADPR + nucleotide pyrophosphatase filtrate, normalized to the current supported by 1 μm ADPR in the same patch, as a function of time following the addition of the filtrate to the test solution. The symbols with error bars represent the values averaged over 2–10 experiments with similar timing. The three time courses represent three protocols for producing the filtrate (panels B–D): 1× passage through 10-kDa molecular mass cut-off filter (black squares), 1× passage through 3-kDa molecular mass cut-off filter (white circles), and 2× passage through 3-kDa molecular mass cut-off filters (black circles).
FIGURE 6.
FIGURE 6.
Pure cADPR does not stimulate TRPM2 channel activity in cell-free patches. A, D, and G, no currents are activated by direct superfusion of inside-out patches with 10 μm purified cADPR in the presence of 125 μm Ca2+ (A), 15 μm Ca2+ (D), or 15 μm Ca2+ + 2 μm calmodulin (CAM) (G), whereas subsequent exposure to 32 μm ADPR elicits large currents in all three cases. B, E, and H, co-application of 10 μm purified cADPR does not enhance fractional TRPM2 currents activated by 1 μm ADPR in the presence of 125 μm Ca2+ (B), 15 μm Ca2+ (E), or 15 μm Ca2+ + 2 μm calmodulin (H). C, F, and I, fractional currents activated by 10 μm purified cADPR (leftmost bars) and by 0.1 or 1 μm ADPR in the absence (black bars) and presence (gray bars) of 10 μm purified cADPR; the three panels illustrate the results obtained in the presence of 125 μm Ca2+ (C), 15 μm Ca2+ (F), or 15 μm Ca2+ + 2 μm calmodulin (I), respectively. The currents were normalized to those elicited in the same patch by 32 μm ADPR (white bars). The error bars represent S.E. Correction for rundown was done as described for supplemental Fig. S1.
FIGURE 7.
FIGURE 7.
NAADP and NAAD are low affinity direct activators of TRPM2. A–D, TRPM2 currents are activated in inside-out patches by superfusion with increasing concentrations of NAADP (A and C), ADPR (B), or NAAD (D) in the presence of saturating Ca2+ (bars). In B and C, 50 μm NAADP and 0.1 μm ADPR, respectively, were applied throughout the exposure to the tested nucleotide (bars). E, dose-response curves for fractional activation by NAADP (black squares), NAAD (black diamonds), ADPR (black circles, replotted from Fig. 1C), ADPR in the presence of a constant 50 μm NAADP (white circles), and NAADP in the presence of a constant 0.1 μm ADPR (white squares); the leftmost data points for the latter two curves (*) represent zero agonist concentrations. All of the curves were obtained in the presence of saturating Ca2+ and normalized to the current obtained in 32 μm ADPR in the same patch; the latter corresponds to an open probability of close to unity (9). The solid lines represent fits to the Hill equation; the predicted midpoints are printed in the panel. For the fit to the ADPR dose-response curve in the presence of 50 μm NAADP, a constant term was included (see Fig. 4D). F, TLC analysis of 1-μl aliquots of (from left to right) 10 mm ADPR, 100 mm NAAD, 100 mm NAADP, 100 mm NAD, and 32 mm ADPR. Note ADPR contamination in NAD, and a rapidly migrating contaminant in ADPR (also visible in Fig. 5A). G, TLC analysis of 1-μl aliquots of (from left to right) 2 mm adenine, 2 mm adenosine, and 10 mm ADPR. The rapidly migrating contaminant in ADPR is fluorescent and roughly co-migrates with adenine. H, fractional activation by 50 μm (left) and 1 mm (right) NAADP in the absence (black bars) and presence (white bars) of 0.1 μm ADPR at subsaturating (15 μm) [Ca2+]i; the currents were normalized to that obtained in the same patch in the presence of 15 μm Ca2+ + 32 μm ADPR. Correction for rundown was done as described in supplemental Fig. S1. The error bars in E and H represent S.E.

Similar articles

Cited by

References

    1. Nagamine K., Kudoh J., Minoshima S., Kawasaki K., Asakawa S., Ito F., Shimizu N. (1998) Genomics 54, 124–131 - PubMed
    1. Perraud A. L., Fleig A., Dunn C. A., Bagley L. A., Launay P., Schmitz C., Stokes A. J., Zhu Q., Bessman M. J., Penner R., Kinet J. P., Scharenberg A. M. (2001) Nature 411, 595–599 - PubMed
    1. Sano Y., Inamura K., Miyake A., Mochizuki S., Yokoi H., Matsushime H., Furuichi K. (2001) Science 293, 1327–1330 - PubMed
    1. Hara Y., Wakamori M., Ishii M., Maeno E., Nishida M., Yoshida T., Yamada H., Shimizu S., Mori E., Kudoh J., Shimizu N., Kurose H., Okada Y., Imoto K., Mori Y. (2002) Mol. Cell 9, 163–173 - PubMed
    1. Heiner I., Eisfeld J., Warnstedt M., Radukina N., Jüngling E., Lückhoff A. (2006) Biochem. J. 398, 225–232 - PMC - PubMed

Publication types