. 2010 Oct;299(4):G954-66.
doi: 10.1152/ajpgi.00246.2010. Epub 2010 Jul 22.

Chronic ethanol consumption enhances sensitivity to Ca(2+)-mediated opening of the mitochondrial permeability transition pore and increases cyclophilin D in liver

Affiliations

Chronic ethanol consumption enhances sensitivity to Ca(2+)-mediated opening of the mitochondrial permeability transition pore and increases cyclophilin D in liver

Adrienne L King et al. Am J Physiol Gastrointest Liver Physiol. 2010 Oct.

Abstract

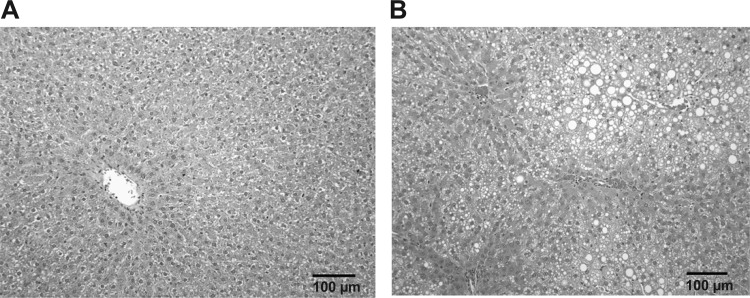
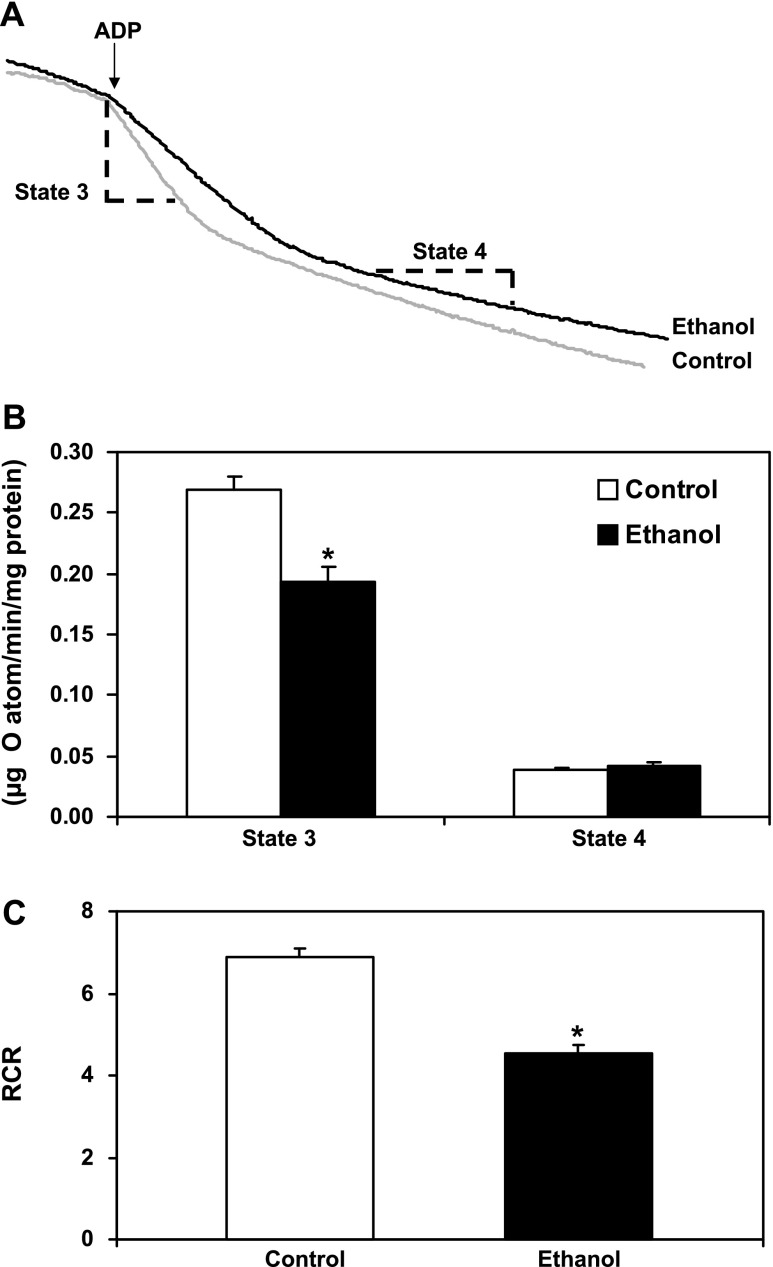
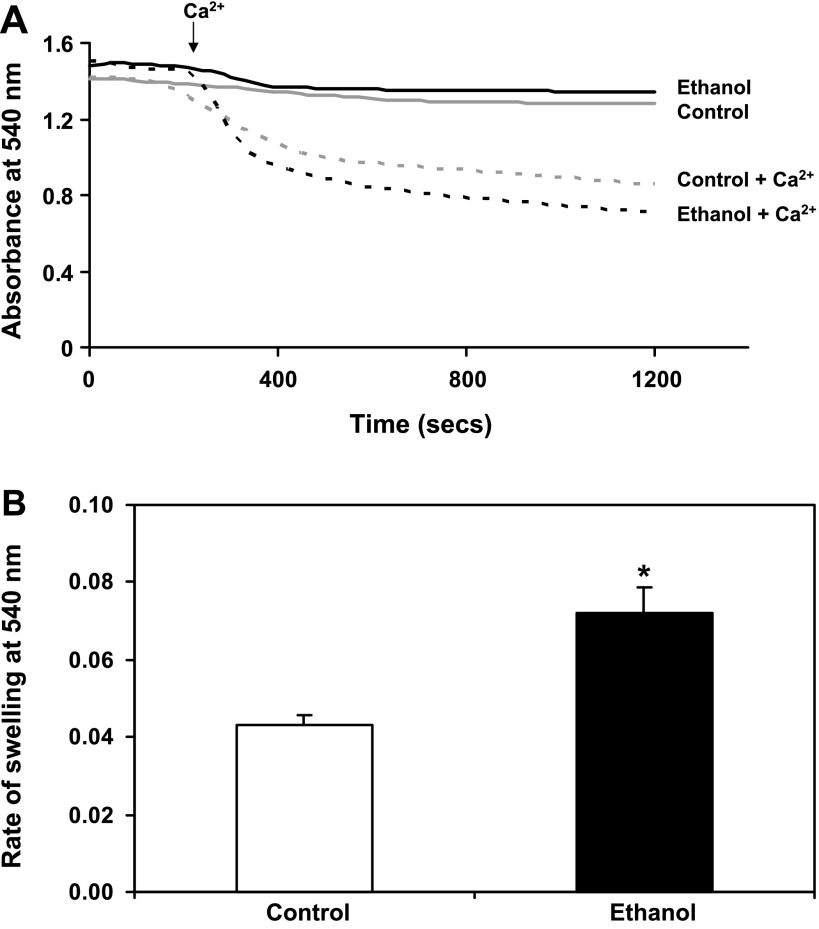
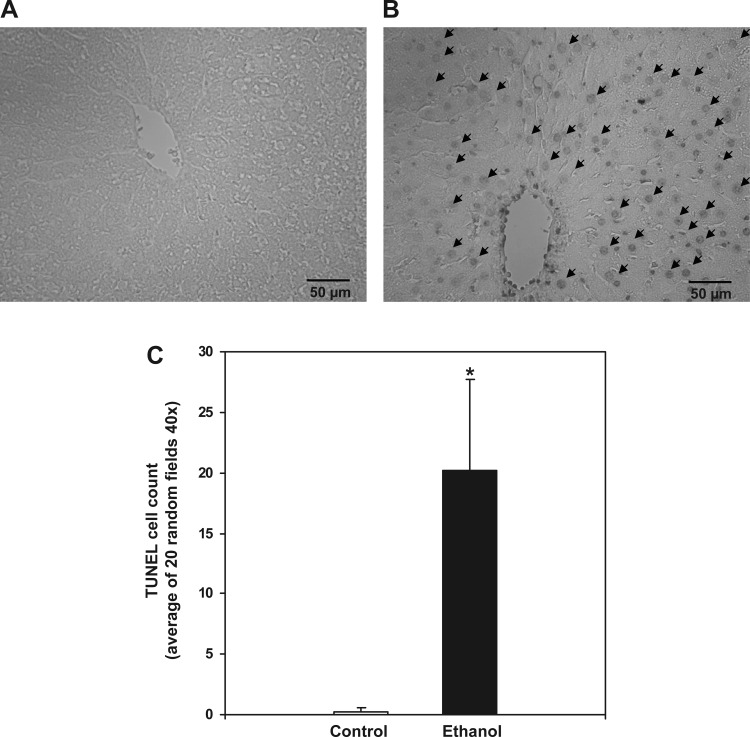
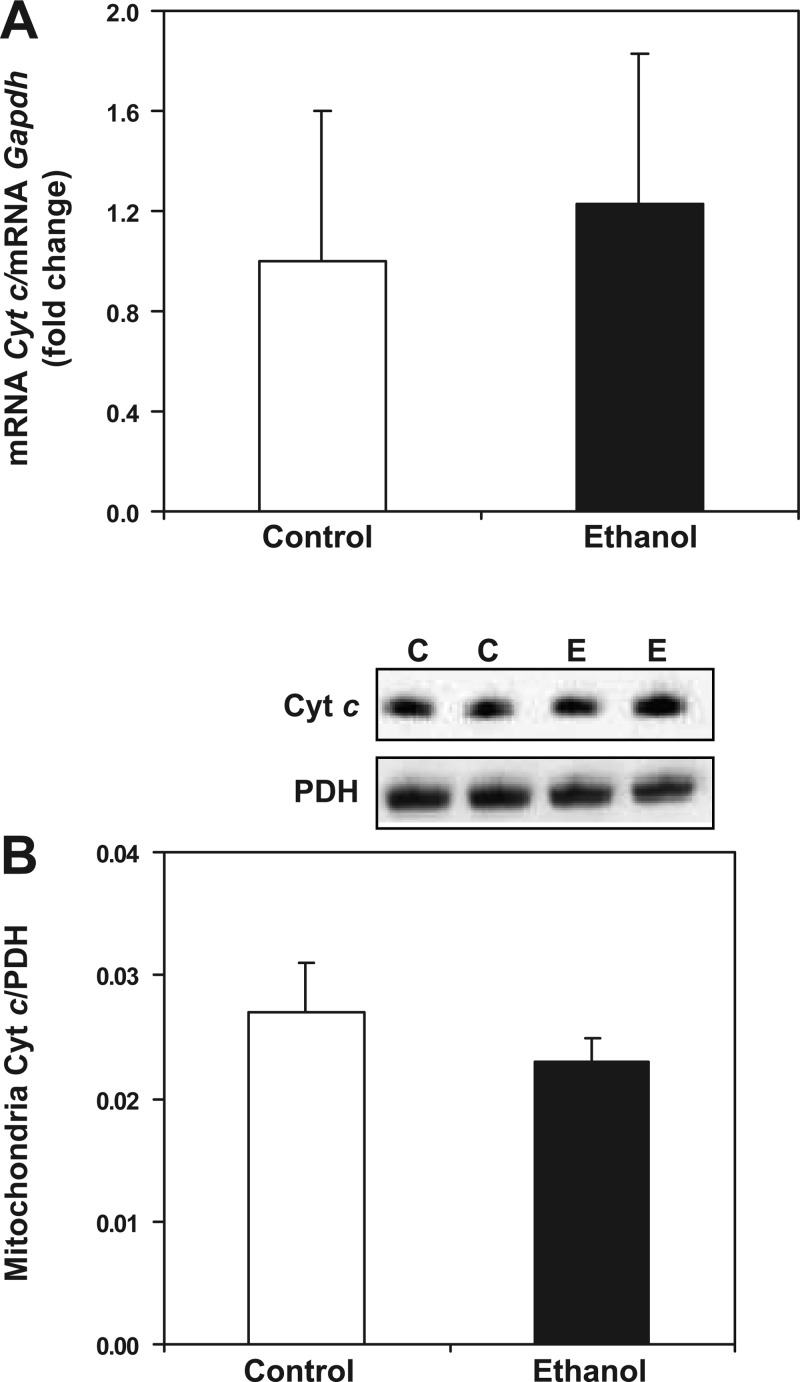
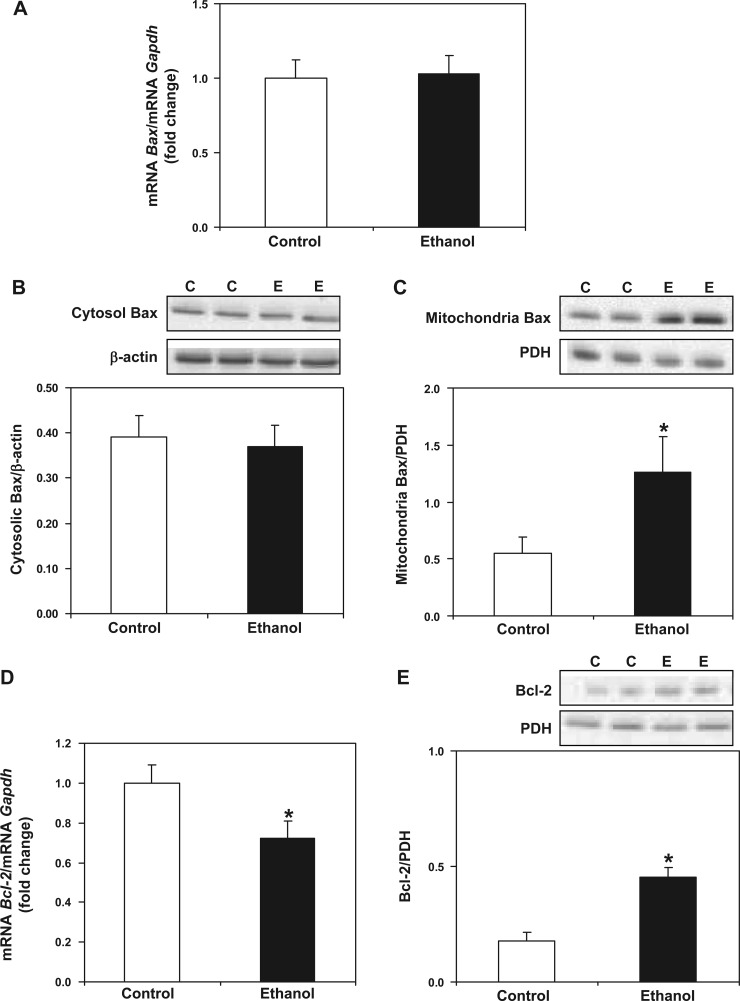
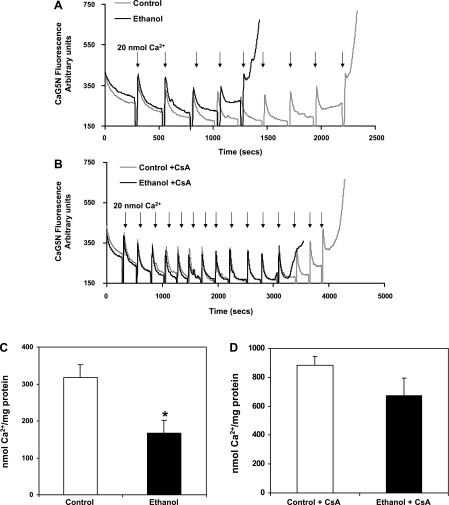
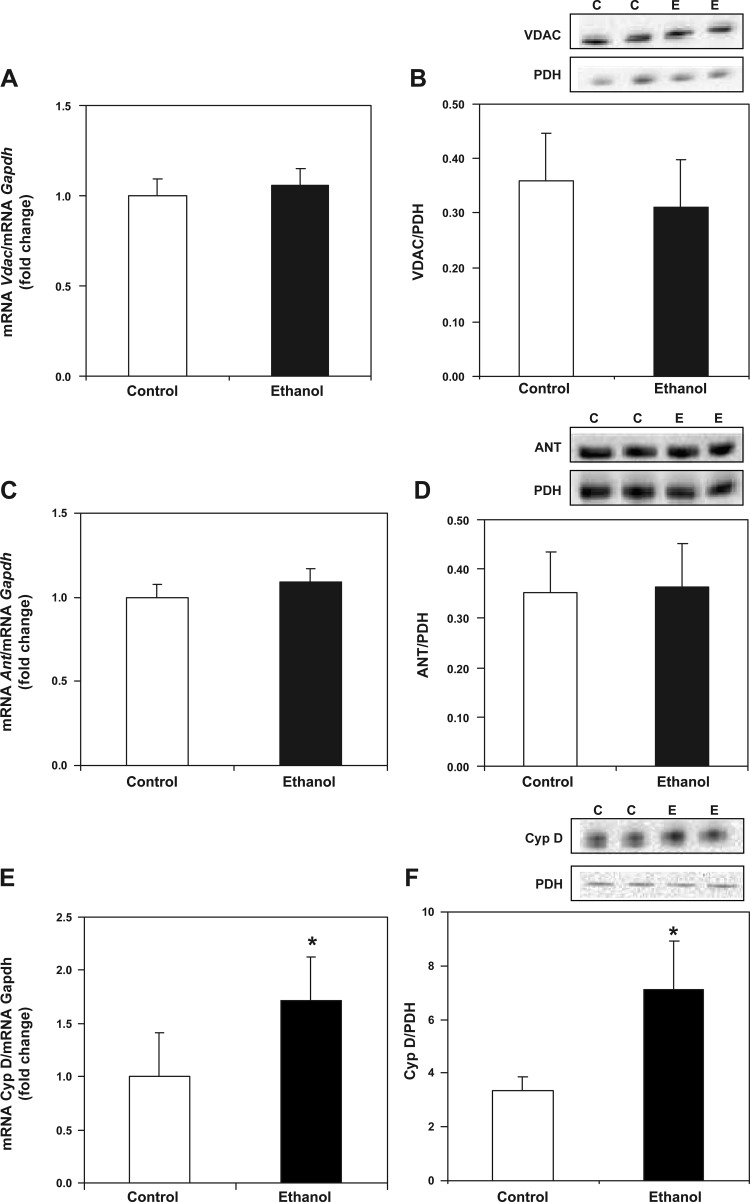
Chronic ethanol consumption increases mitochondrial oxidative stress and sensitivity to form the mitochondrial permeability transition pore (MPTP). The mechanism responsible for increased MPTP sensitivity in ethanol-exposed mitochondria and its relation to mitochondrial Ca(2+) handling is unknown. Herein, we investigated whether increased sensitivity to MPTP induction in liver mitochondria from ethanol-fed rats compared with controls is related to an ethanol-dependent change in mitochondrial Ca(2+) accumulation. Liver mitochondria were isolated from control and ethanol-fed rats, and Ca(2+)-mediated induction of the MPTP and mitochondrial Ca(2+) retention capacity were measured. Levels of proposed MPTP proteins as well as select pro- and antiapoptotic proteins were measured along with gene expression. We observed increased steatosis and TUNEL-stained nuclei in liver of ethanol-fed rats compared with controls. Liver mitochondria from ethanol-fed rats had increased levels of proapoptotic Bax protein and reduced Ca(2+) retention capacity compared with control mitochondria. We observed increased cyclophilin D (Cyp D) gene expression in liver and protein in mitochondria from ethanol-fed animals compared with controls, whereas there was no change in the adenine nucleotide translocase and voltage-dependent anion channel. Together, these results suggest that enhanced sensitivity to Ca(2+)-mediated MPTP induction may be due, in part, to higher Cyp D levels in liver mitochondria from ethanol-fed rats. Therefore, therapeutic strategies aimed at normalizing Cyp D levels may be beneficial in preventing ethanol-dependent mitochondrial dysfunction and liver injury.


Figures

Fig. 1.
Fig. 1.
Chronic ethanol consumption causes liver steatosis. Light microscopy images from representative livers of control- and ethanol-fed rats. A: representative image of hematoxylin-eosin-stained liver section from a control-fed rat. B: representative image of hematoxylin-eosin-stained liver section from ethanol-fed rat. Note that these images are from the same control and ethanol pair and are representative of 6 pairs of control- and ethanol-fed rats. Magnification is ×20.
Fig. 2.
Fig. 2.
Chronic ethanol consumption decreases mitochondrial respiration. A: representative results from oxygen consumption studies from control (gray line) and ethanol (black line) mitochondria. Oxygen consumption was determined using succinate as the oxidizable substrate. ADP was added at the arrow to initiate state 3 respiration (dashed line marking). After all ADP is converted to ATP, mitochondria enter state 4 respiration (lower rate of respiration), which is marked on the trace (dashed line marking). B: state 3 respiration was significantly lower in ethanol mitochondria compared with controls, whereas there was no difference in state 4 respiration between groups. C: the respiratory control ratio (RCR; state 3/state 4 respiration) was significantly lower in ethanol mitochondria compared with controls. Data are expressed as the mean ± SE for 6 pairs of control- and ethanol-fed rats. *P < 0.05 compared with control.
Fig. 3.
Fig. 3.
Chronic ethanol consumption increases sensitivity to Ca2+-mediated mitochondrial swelling. Isolated mitochondria (0.25 mg/ml) were incubated in a KCl-based buffer containing 150 mM KCl, 25 mM NaHCO3, 1 mM MgCl2, 1 mM KH2PO4, and 20 mM HEPES, pH 7.4. A: representative results of mitochondrial swelling using 0 (solid lines) and 200 nmol Ca2+ (dashed lines) at an absorbance of 540 nm. B: the decrease in absorbance was followed for 20 min, and the rate of swelling was calculated from the initial slope of the decrease in absorbance (i.e., from 180–330 s). Mitochondria from ethanol-treated animals (black dashed line) were significantly more sensitive to Ca2+-mediated mitochondrial swelling than mitochondria from control animals (gray dashed line). Data are expressed as the mean ± SE for 6 pairs of control- and ethanol-fed rats. *P < 0.05 compared with control.
Fig. 4.
Fig. 4.
Chronic ethanol consumption increases hepatic terminal deoxynucleotidyl transferase dUTP nick-end labeling (TUNEL) staining. TUNEL-positive nuclei were visualized in formalin-fixed liver sections for control- (A) and ethanol-fed rats (B). Images are representative of at least 6 rats/treatment group taken at ×40 magnification. C: for quantification, the number of TUNEL-positive cells per liver sample was counted from 20 random high-powered fields (×40 magnification). Data are expressed as the mean ± SE for 6 pairs of control- and ethanol-fed rats. *P < 0.05 compared with control.
Fig. 5.
Fig. 5.
Effect of chronic ethanol consumption on cytochrome c (Cyt c) transcript and protein levels. For gene expression analyses, total RNA was isolated and measured by real-time PCR. The relative amount of mRNA was determined using the comparative threshold (Ct) method by normalizing target cDNA levels to Gapdh. Protein was measured by Western blotting technique and normalized to pyruvate dehydrogenase (PDH). A: there was no difference in Cyt c gene expression between control- (C) and ethanol-fed (E) animals. B: there was no difference in mitochondrial Cyt c protein between control and ethanol groups. Data are expressed as the mean ± SE for 6 pairs of control- and ethanol-fed rats.
Fig. 6.
Fig. 6.
Effect of chronic ethanol consumption on transcript and protein levels of key pro- and antiapoptotic mediators. For gene expression analyses, total RNA was isolated and measured by real-time PCR. The relative amount of mRNA was determined using the Ct method by normalizing target cDNA levels to Gapdh. Protein was measured by Western blotting technique and normalized to either β-actin or PDH. A: there was no difference in Bax gene expression between control- and ethanol-fed animals. The proapoptotic protein Bax was measured in cytosolic (B) and mitochondrial fractions (C). There was no difference in cytosolic Bax protein between control- and ethanol-fed rats. There was a significant increase in mitochondrial Bax protein in ethanol compared with control rats. D: there was a significant decrease in Bcl-2 gene expression in ethanol compared with control animals. E: Bcl-2 protein was increased significantly in liver mitochondria from ethanol-fed rats compared with controls. Data are expressed as means ± SE for 6 pairs of control- and ethanol-fed rats. *P < 0.05 compared with control.
Fig. 7.
Fig. 7.
Effect of chronic ethanol consumption on liver mitochondria Ca2+ retention capacity. Liver mitochondria (0.2 mg/ml) were incubated in respiration buffer (130 mM KCl, 2 mM KH2PO4, 3 mM HEPES, and 2 mM MgCl2) with 8 mM succinate, 1 μM rotenone, 0.2 mM ADP, 1 μg/ml oligomycin, and 0.2 μM Calcium Green 5N (CaG5N). A: representative results of Ca2+ uptake in control (gray line) and ethanol (black line) mitochondria. Ca2+ was added as 20-nmol additions every 240 s (i.e., 20 nmol at each arrow). Mitochondrial Ca2+ retention capacity was lower in ethanol compared with control mitochondria before MPTP induction. B: representative results of Ca2+ uptake in control (gray line) and ethanol (black line) mitochondria pretreated with cyclosporin A (CsA). Ca2+ was added as 20-nmol additions every 240 s (i.e., 20 nmol at each arrow). Note that in the presence of CsA, mitochondrial Ca2+ retention capacity was increased for both control and ethanol mitochondria. C: quantification of mitochondrial Ca2+ retention capacity in ethanol and control mitochondria. D: quantification of mitochondrial Ca2+ retention capacity in ethanol and control mitochondria pretreated with CsA. Data are expressed as the mean ± SE for 6 pairs of control- and ethanol-fed rats. *P < 0.005 compared with control.
Fig. 8.
Fig. 8.
Chronic ethanol consumption increases cyclophilin D (Cyp D) transcript and protein levels. For gene expression analyses, total RNA was isolated and measured by real-time PCR. The relative amount of mRNA was determined using the Ct method by normalizing target cDNA levels to Gapdh. Protein was measured by Western blotting technique and normalized to PDH. A: there was no difference in voltage-dependent anion channel (Vdac) gene expression between control and ethanol groups. B: there was no difference in VDAC protein between control and ethanol mitochondria. C: there was no difference in adenine nucleotide translocase (Ant) gene expression between control and ethanol groups. D: There was no difference in ANT protein between control and ethanol mitochondria. E: there was a significant increase in Cyp D gene expression in liver from ethanol-fed compared with control animals. F: there was a significant increase in Cyp D protein in ethanol compared with control mitochondria. Data are expressed as the mean ± SE for 6 pairs of control- and ethanol-fed rats. *P < 0.05 compared with control.

Similar articles

Cited by

References

    1. Adachi M, Higuchi H, Miura S, Azuma T, Inokuchi S, Saito H, Kato S, Ishii H. Bax interacts with the voltage-dependent anion channel and mediates ethanol-induced apoptosis in rat hepatocytes. Am J Physiol Gastrointest Liver Physiol 287: G695–G705, 2004. - PubMed
    1. Albano E. Alcohol, oxidative stress and free radical damage. Proc Nutr Soc 65: 278–290, 2006. - PubMed
    1. Andreeva L, Heads R, Green CJ. Cyclophilins and their possible role in the stress response. Int J Exp Pathol 80: 305–315, 1999. - PMC - PubMed
    1. Andringa KK, King AL, Eccleston HB, Mantena SK, Landar A, Jhala NC, Dickinson DA, Squadrito GL, Bailey SM. Analysis of the liver mitochondrial proteome in response to ethanol and S-adenosylmethionine treatments: novel molecular targets of disease and hepatoprotection. Am J Physiol Gastrointest Liver Physiol 298: G732–G745, 2010. - PMC - PubMed
    1. Antonsson B. Bax and other pro-apoptotic Bcl-2 family “killer-proteins” and their victim the mitochondrion. Cell Tissue Res 306: 347–361, 2001. - PubMed

Publication types