. 2010 Sep;177(3):1122-30.
doi: 10.2353/ajpath.2010.090889. Epub 2010 Jul 22.

Establishment and characterization of an experimental model of coronary thrombotic microembolism in rats

Affiliations

Establishment and characterization of an experimental model of coronary thrombotic microembolism in rats

Ye Gu et al. Am J Pathol. 2010 Sep.

Abstract

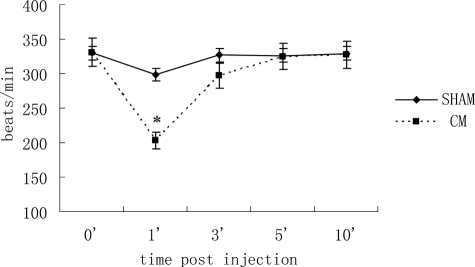
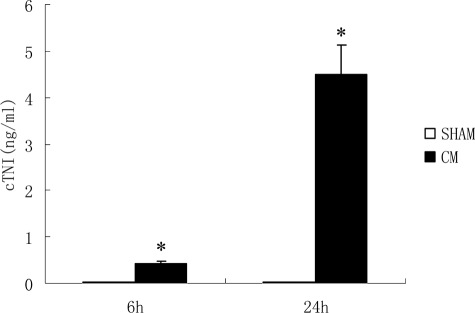
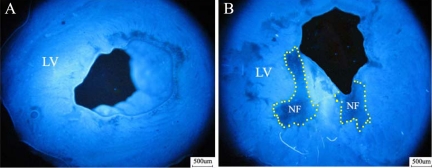
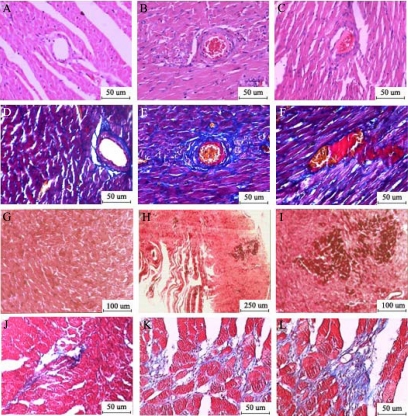
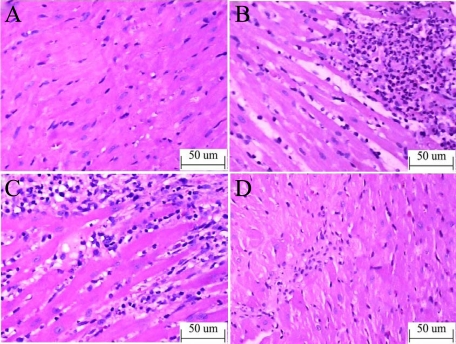
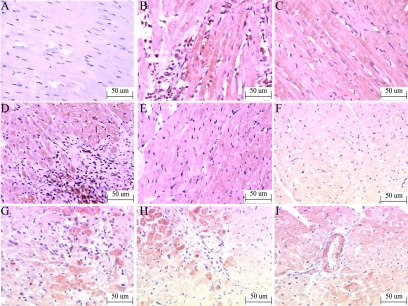
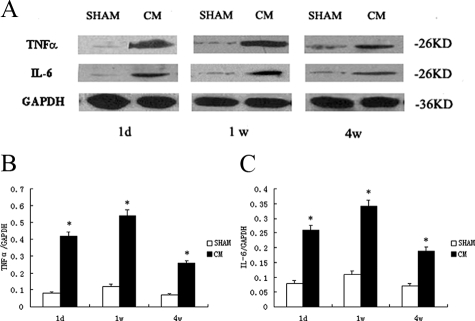
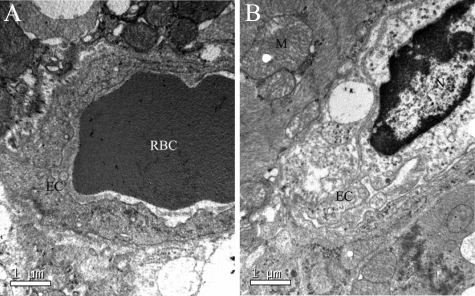
To establish a model of coronary thrombotic microembolism in rats, either automicrothrombotic particulates (CM group) or saline control (SHAM group) was injected into temporarily clamped aortas of male Sprague-Dawley rats. After automicrothrombotic particulate injection, serum c-troponin I and von Willebrand factor levels, the no-flow area as evaluated by Thioflavin S, myocardial leukocyte infiltration levels, myocardial expressions of tumor necrosis factor alpha and interleukin-6, the percentage of arterioles obstructed by thrombosis, and myocardial fibrosis were all significantly increased whereas cardiac function as evaluated by echocardiography and hemodynamic measurements were significantly reduced compared with the sham group. Thus, aortic automicrothrombotic particulate injection could induce coronary microembolism in rats, and this model could be of value in improving the understanding of pathophysiology of coronary microembolism.


Figures

Figure 1
Figure 1
Heart rate changes after injection. Heart rate decreased significantly at one minute and returned to normal after five minutes in the CM group. Values are means ± SD. *P < 0.01 versus sham group.
Figure 2
Figure 2
Serum c-TNI level after injections. Serum c-troponin I increased significantly in the CM group compared with that in the sham group. Values are means ± SD. *P < 0.01 versus sham group at corresponding time post-injection.
Figure 3
Figure 3
No-flow zone evaluation at three hours post-injection. Under UV light, the no-flow zone was identified as a region deficient in fluorescence of Thioflavin S (A, sham ×40; B, CM ×40). LV indicates the left ventricle and a yellow dotted line delineates the no-flow zone.
Figure 4
Figure 4
Light microscopic analyses. In the HE-stained slice (A, sham; B and C, CM ×200), red thrombosis was not observed in arterioles of the sham group (A) but seen in the CM group (B, C). Carstairs staining (D, sham; E and F, CM ×200) showed the major components of thrombosis in CM group were fibrins (bright red) and platelets (gray-blue to navy blue). HBFP staining (G, sham; H, CM ×40; I, CM ×100) showed two small flaky cardinal red regions three hours after injection in CM group (H, I). Masson staining at four weeks post-injection (J, sham; K and L, CM ×200) showed increased collagen deposition in CM group (K and L).
Figure 5
Figure 5
Inflammatory cell infiltration in HE staining. A: Sham; B: CM 24 hours; C: CM 1 week; D: CM 4 weeks ×200) increased polymorphonuclear leukocyte infiltration in microinfarct zone in the CM group 24 hours after injection (B) and increased macrophages and leukomonocytes infiltration near microinfarct zone in CM group one week after injection (C).
Figure 6
Figure 6
Immunohistochemistry staining. TNFα (A, sham; B, CM 24 hours at microinfarct/peri-microinfarct zone; C, CM 24 hours at “normal” myocardium; D, CM one week at microinfarct/peri-microinfarct zone; E, CM four weeks at “normal” myocardium, ×200); and IL-6 (F, sham; G, CM 24 hours at peri-microinfarct zone; H, CM 1 week at perivascular zone; I, CM four weeks at perivascular zone, ×200).
Figure 7
Figure 7
Western blot analyses of TNFα and IL-6. A: The expressions of TNFα and IL-6 at different stages. B: Representative of TNFα/GAPDH at different stages. C: Representative of IL-6/GAPDH at different stages. Values are means ± SD; *P < 0.01 versus sham group.
Figure 8
Figure 8
Electron microscopic analysis. A: Sham group. B: CM group. EC, endothelial cell; N, nucleolus; RBC, red blood cell; M, mitochondria.

Similar articles

Cited by

References

    1. Skyschally A, Leineweber K, Gres P, Haude M, Erbel R, Heusch G. Coronary microembolization. Basic Res Cardiol. 2006;101:373–382. - PubMed
    1. Erbel R, Heusch G. Coronary microembolization: its role in acute coronary syndromes and interventions. Herz. 1999;24:558–575. - PubMed
    1. Bahrmann P, Figulla HR, Wagner M, Ferrari M, Voss A, Werner GS. Detection of coronary microembolisation by Doppler ultrasound during percutaneous coronary interventions. Heart. 2005;91:1186–1192. - PMC - PubMed
    1. Jaffe R, Charron T, Puley G, Dick A, Strauss BH. Microvascular obstruction and the no-reflow phenomenon after percutaneous coronary intervention. Circulation. 2008;117:3152–3156. - PubMed
    1. Topol EJ, Yadav JS. recognition of the importance of embolization in atherosclerotic vascular disease. Circulation. 2000;101:570–580. - PubMed