. 2010 Sep 1;70(17):6957-67.
doi: 10.1158/0008-5472.CAN-10-1169. Epub 2010 Jul 22.

Voltage-gated Na+ channel SCN5A is a key regulator of a gene transcriptional network that controls colon cancer invasion

Affiliations

Voltage-gated Na+ channel SCN5A is a key regulator of a gene transcriptional network that controls colon cancer invasion

Carrie D House et al. Cancer Res. .

Abstract

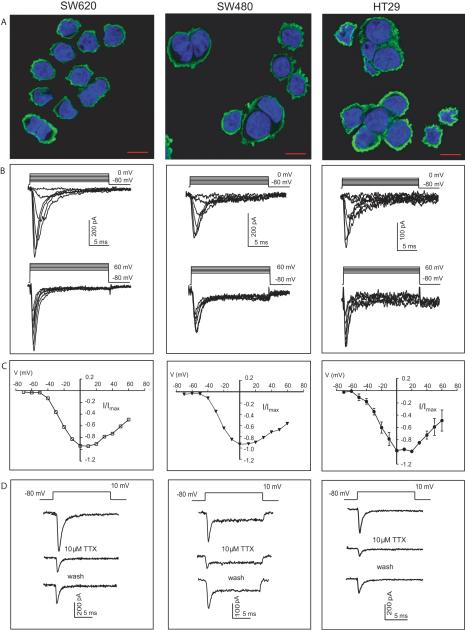
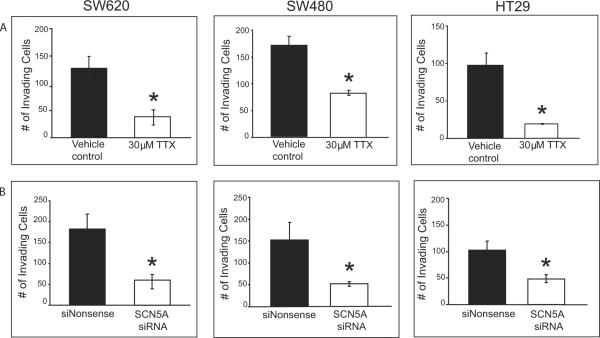
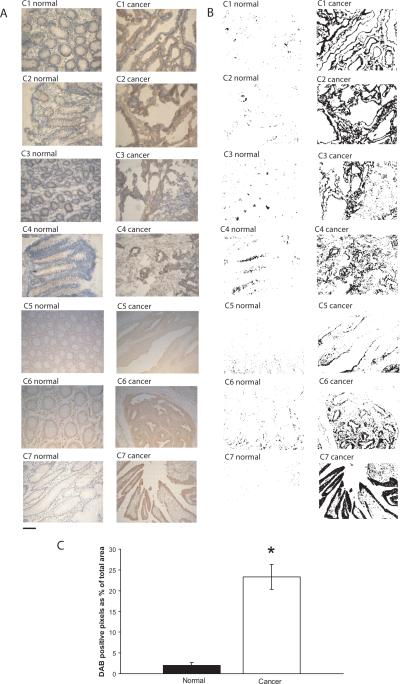
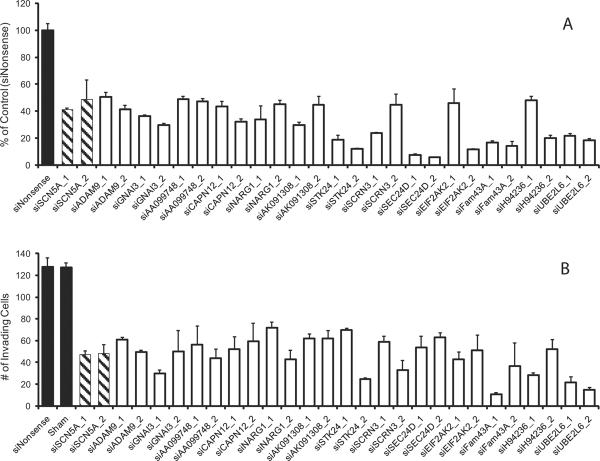
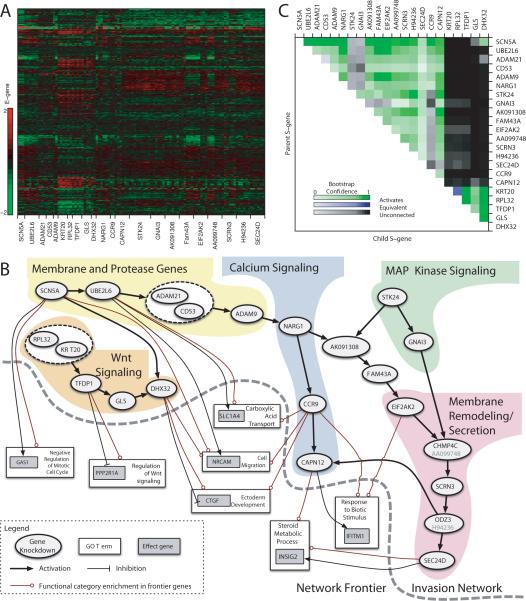
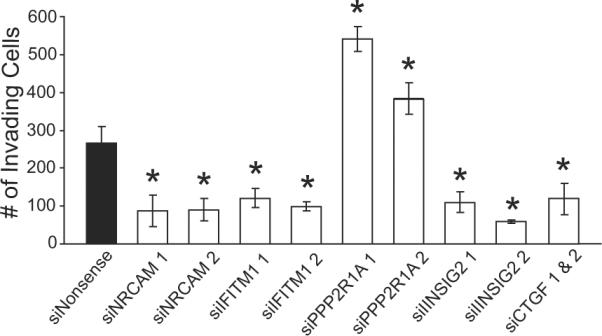
Voltage-gated Na(+) channels (VGSC) have been implicated in the metastatic potential of human breast, prostate, and lung cancer cells. Specifically, the SCN5A gene encoding the VGSC isotype Na(v)1.5 has been defined as a key driver of human cancer cell invasion. In this study, we examined the expression and function of VGSCs in a panel of colon cancer cell lines by electrophysiologic recordings. Na(+) channel activity and invasive potential were inhibited pharmacologically by tetrodotoxin or genetically by small interfering RNAs (siRNA) specifically targeting SCN5A. Clinical relevance was established by immunohistochemistry of patient biopsies, with strong Na(v)1.5 protein staining found in colon cancer specimens but little to no staining in matched-paired normal colon tissues. We explored the mechanism of VGSC-mediated invasive potential on the basis of reported links between VGSC activity and gene expression in excitable cells. Probabilistic modeling of loss-of-function screens and microarray data established an unequivocal role of VGSC SCN5A as a high level regulator of a colon cancer invasion network, involving genes that encompass Wnt signaling, cell migration, ectoderm development, response to biotic stimulus, steroid metabolic process, and cell cycle control. siRNA-mediated knockdown of predicted downstream network components caused a loss of invasive behavior, demonstrating network connectivity and its function in driving colon cancer invasion.


Figures

Figure 1
Figure 1
Nav1.5 VGSCs are functionally expressed in colon cancer cells. (A) Representative merged images demonstrating Nav1.5 immunoreactivity in SW620, SW480, and HT29 colon cancer cells. Anti-Nav1.5 conjugated to Alexa 488 in green and DAPI nuclear staining in blue. Images are representative of at least three independent experiments (Scale bar 10 μm). (B) Superimposed Na+ currents elicited by depolarizing from −80 mV to between −50 and 0 mV (top traces) and between 10 and 60 mV (bottom traces) in 10 mV increments. (C) Current-voltage (I–V) relationship of Na+ currents elicited by depolarizing from a holding potential of −80 mV to between −70 and 60 mV in 10 mV voltage steps. Current amplitudes were normalized to maximum peak current recorded from each cell. Data are averages of 36, 16, and 15 recordings from SW620 cells, SW480, and HT29 colon cancer cells, respectively. Vertical lines represent ± SEM. Error bars for SW620 and SW480 recordings are within the data symbols. (D) TTX-mediated inhibition of current after bath application of 10 μM TTX. Current is restored after subsequent wash.
Figure 2
Figure 2
Nav1.5 contributes to invasive potential of colon cancer cells (A) The total number of invading SW620, SW480 and HT29 colon cancer cells was significantly reduced with 30 μM TTX compared to vehicle control. (B) siRNA-mediated knockdown of SCN5A significantly reduced invasion potential of colon cancer cells compared to cells treated with a nonsense siRNA used as a control. Results are means ± SEM from at least three independent experiments *Significantly different from control (two-sided, unpaired t-Test, P < 0.05).
Figure 3
Figure 3
Nav1.5 staining is significantly higher in colon cancer tissues compared to normal-matched colon tissues. (A) Nav1.5 immunoreactivity is confined primarily to the plasma membrane of malignant cells in the luminal surface (brown staining in the periphery). Images are representative of at least three independent experiments from each of seven patients (C1 – C7). Sections C1 – C4 were prepared from fresh frozen tissue specimens and C5 – C7 from formalin-fixed paraffin-embedded tissue specimens. (B) DAB+ stained areas selected from 24-bit BN image using preset threshold on ImageJ image processing software. (C) Quantification of DAB+ stained areas is displayed as percent positive pixels divided by total number of pixels. Results are the mean ± SEM. *Significantly different from normal (two-sided, paired t-Test, P < 0.05).
Figure 4
Figure 4
SCN5A and predicted network genes involved in the invasive potential of HT29 cells. siRNA-mediated knockdown of individual genes proposed to be involved in the invasion network leads to a loss of invasion. (A) qRT-PCR was performed to validate mRNA knockdowns were at least 50% or greater. (B) The total number of invading cells was significantly reduced when mRNA expression was knocked-down with siRNA. Results are means ± SEM from at least three independent experiments. All depicted targeted gene knockdowns are significantly different from siNonsense control (ANOVA, post-hoc Tukey, P < 0.05). Successful knockdown of ADAM21, CCR9, CD53, DHX32, GLS, KRT20, RPL32 and TFDP1 genes and loss of invasion potential in HT29 cells have previously been described (20).
Figure 5
Figure 5
Network interactions predicted from E-gene expression under S-gene knockdown. (A) Expression values of selected E-genes. Each row shows the log-ratio expression of a single E-gene under various targeted siRNA-mediated knockdowns relative to a nonsense siRNA control. (B) Inferred S-gene network and Frontier. Nodes represent S-genes (ovals), E-genes (gray boxes), and Gene Ontology categories (white boxes). Arrows indicate activation, and tees indicate repression. Mixed arrow/tee line endings indicate GO set enrichment among both activated and inhibited E-genes. For simplicity only direct interactions are shown. (C) S-gene interaction confidence. Each pixel in the heatmap corresponds to the proportion of times an S-gene interaction was recovered across bootstrap iterations. Upstream S-genes are labeled on the right; downstream on the top. Rows show upstream and columns show downstream bootstrap proportion.
Figure 6
Figure 6
Validation of predicted downstream network interactions. Significant changes in invasion occur with siRNA-mediated knockdown of frontier E-genes predicted to be connected to the invasion network. Knockdowns were determined to be ≥50% by qRT-PCR. Results are means ± SEM from three independent experiments for each siRNA. *Significantly different from siNonsense control (ANOVA, post-hoc Tukey, P < 0.05).

References

    1. Kunzelmann K. Ion channels and cancer. J Membr Biol. 2005;205(3):159–73. - PubMed
    1. Schuller HM. Is cancer triggered by altered signalling of nicotinic acetylcholine receptors? Nature reviews. 2009;9(3):195–205. - PubMed
    1. Onkal R, Djamgoz MB. Molecular pharmacology of voltage-gated sodium channel expression in metastatic disease: clinical potential of neonatal Nav1.5 in breast cancer. European journal of pharmacology. 2009;625(1–3):206–19. - PubMed
    1. Roger S, Potier M, Vandier C, Besson P, Le Guennec JY. Voltage-gated sodium channels: new targets in cancer therapy? Curr Pharm Des. 2006;12(28):3681–95. - PubMed
    1. Hodgkin AL, Huxley AF. A quantitative description of membrane current and its application to conduction and excitation in nerve. J Physiol. 1952;117(4):500–44. - PMC - PubMed

Publication types