. 2010 Jul 22;466(7305):482-5.
doi: 10.1038/nature09210.

Coupled dynamics of body mass and population growth in response to environmental change

Affiliations

Coupled dynamics of body mass and population growth in response to environmental change

Arpat Ozgul et al. Nature. .

Abstract

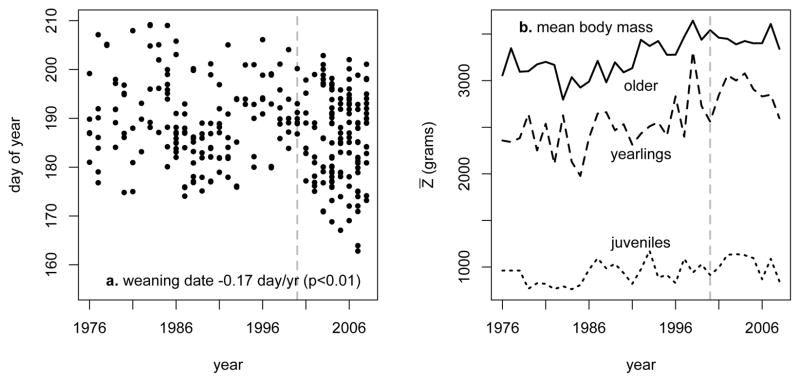
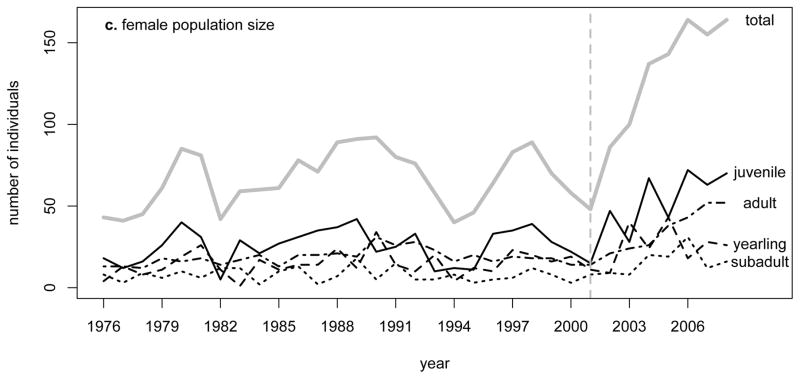
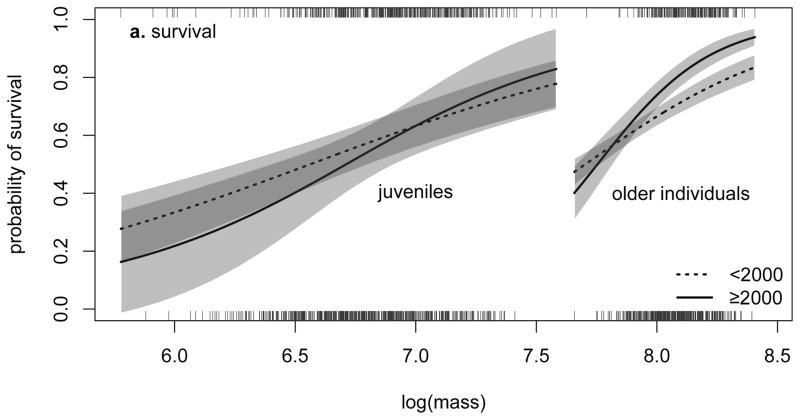
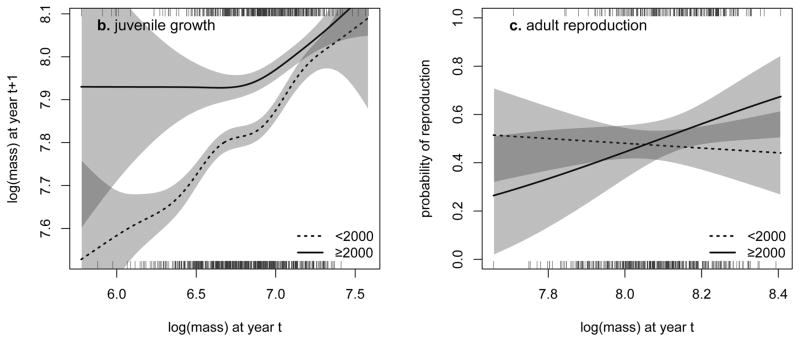
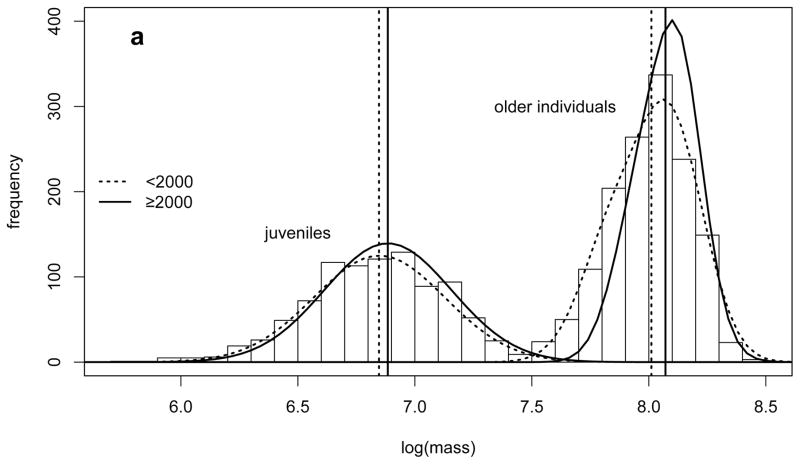
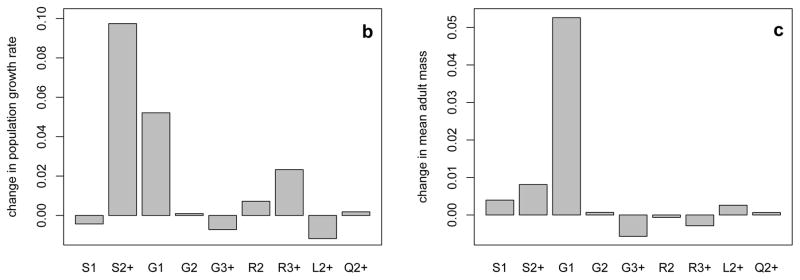
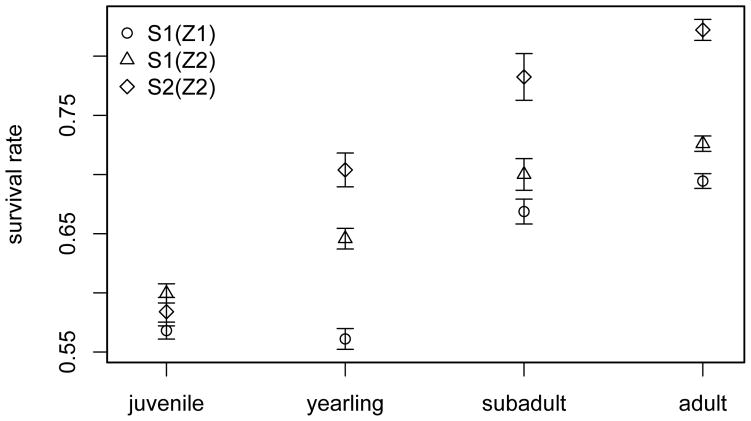
Environmental change has altered the phenology, morphological traits and population dynamics of many species. However, the links underlying these joint responses remain largely unknown owing to a paucity of long-term data and the lack of an appropriate analytical framework. Here we investigate the link between phenotypic and demographic responses to environmental change using a new methodology and a long-term (1976-2008) data set from a hibernating mammal (the yellow-bellied marmot) inhabiting a dynamic subalpine habitat. We demonstrate how earlier emergence from hibernation and earlier weaning of young has led to a longer growing season and larger body masses before hibernation. The resulting shift in both the phenotype and the relationship between phenotype and fitness components led to a decline in adult mortality, which in turn triggered an abrupt increase in population size in recent years. Direct and trait-mediated effects of environmental change made comparable contributions to the observed marked increase in population growth. Our results help explain how a shift in phenology can cause simultaneous phenotypic and demographic changes, and highlight the need for a theory integrating ecological and evolutionary dynamics in stochastic environments.


Figures

Figure 1
Figure 1
Trends in (A) the time of weaning, (B) mean August 1st mass () and (C) abundance in each age class for the female segment of the population. The four age-classes are juvenile (< 1 yr), yearling (1 yr-old), subadult (2 yrs-old) and adult (≥3 yrs-old). Subadult and adult masses are combined. Vertical dotted lines delineate different phases of population dynamics.
Figure 1
Figure 1
Trends in (A) the time of weaning, (B) mean August 1st mass () and (C) abundance in each age class for the female segment of the population. The four age-classes are juvenile (< 1 yr), yearling (1 yr-old), subadult (2 yrs-old) and adult (≥3 yrs-old). Subadult and adult masses are combined. Vertical dotted lines delineate different phases of population dynamics.
Figure 2
Figure 2
The relationship between body mass and (A) survival, (B) juvenile growth, and (C) adult reproduction for <2000 and ≥2000 years. Shaded areas indicate the 95% confidence intervals, and rugs below and above the graph represent the distribution of the body mass data for <2000 and ≥2000 years, respectively.
Figure 2
Figure 2
The relationship between body mass and (A) survival, (B) juvenile growth, and (C) adult reproduction for <2000 and ≥2000 years. Shaded areas indicate the 95% confidence intervals, and rugs below and above the graph represent the distribution of the body mass data for <2000 and ≥2000 years, respectively.
Figure 3
Figure 3
(A) Stable August log-body mass distributions (lines) for juveniles and older individuals for <2000 and ≥2000 years. Vertical lines show the mean body masses. Bars indicate the actual observed distribution over the entire study period. Retrospective perturbation analysis of the integral projection model gives the relative contribution of each function to (B) population growth and to (C) change in mean adult body mass from <2000 to ≥2000 period (S: survival, G: growth, R: reproduction probability, L: litter size, Q: offspring mass, subscripts indicate the age classes).
Figure 3
Figure 3
(A) Stable August log-body mass distributions (lines) for juveniles and older individuals for <2000 and ≥2000 years. Vertical lines show the mean body masses. Bars indicate the actual observed distribution over the entire study period. Retrospective perturbation analysis of the integral projection model gives the relative contribution of each function to (B) population growth and to (C) change in mean adult body mass from <2000 to ≥2000 period (S: survival, G: growth, R: reproduction probability, L: litter size, Q: offspring mass, subscripts indicate the age classes).
Figure 4
Figure 4
The relative contributions of the change in mean August mass (Z1 to Z2) and the change in survival curve (S1 to S2) to the increase in mean survival in each age class from <2000 to ≥2000 years. The proximity of the triangle [S1(Z2)] to the circle [S1(Z1)] versus to the diamond [S2(Z2)] indicates the contributions of the change in mean mass versus the change in survival curve. Confidence intervals indicate the process variation estimated using the particular mass distribution and survival function.

Comment in

Similar articles

Cited by

References

    1. Walther G, et al. Ecological responses to recent climate change. Nature. 2002;416:389–395. - PubMed
    1. Parmesan C. Ecological and evolutionary responses to recent climate change. Annual Review of Ecology Evolution and Systematics. 2006;37:637–669.
    1. Stenseth N, Mysterud A. Climate, changing phenology, and other life history traits: Nonlinearity and matchñmismatch to the environment. Proceedings of the National Academy of Sciences. 2002;99:13379. - PMC - PubMed
    1. Coulson T, Benton TG, Lundberg P, Dall SRX, Kendall BE. Putting evolutionary biology back in the ecological theatre: a demographic framework mapping genes to communities. Evolutionary Ecology Research. 2006;8:1155–1171.
    1. Chevin LM, Lande R, Mace GM. Adaptation, plasticity and extinction in a changing environment: Towards a predictive theory. PLoS Biology. (submitted) - PMC - PubMed

Publication types