. 2010:2010:928628.
doi: 10.1155/2010/928628. Epub 2010 Jun 28.

Inhibition of melanoma angiogenesis by telomere homolog oligonucleotides

Affiliations

Inhibition of melanoma angiogenesis by telomere homolog oligonucleotides

Christina Coleman et al. J Oncol. 2010.

Abstract

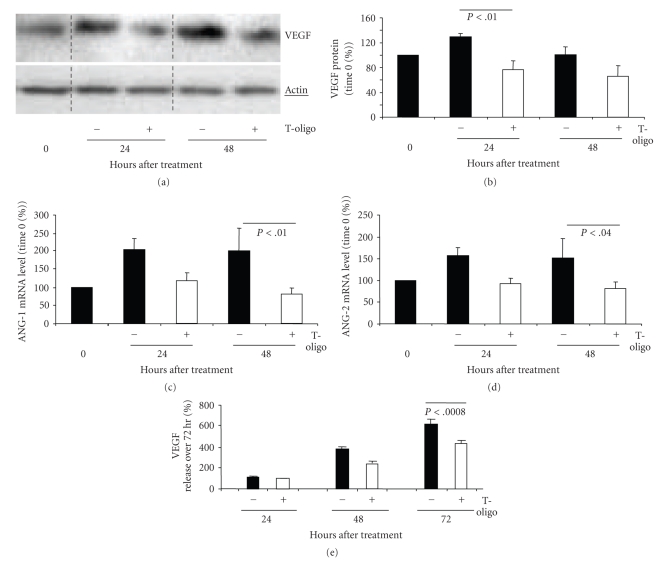
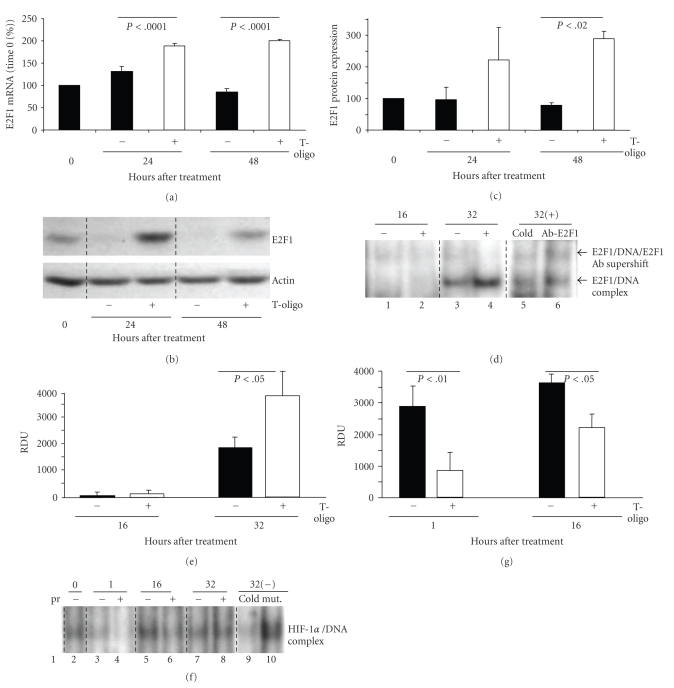
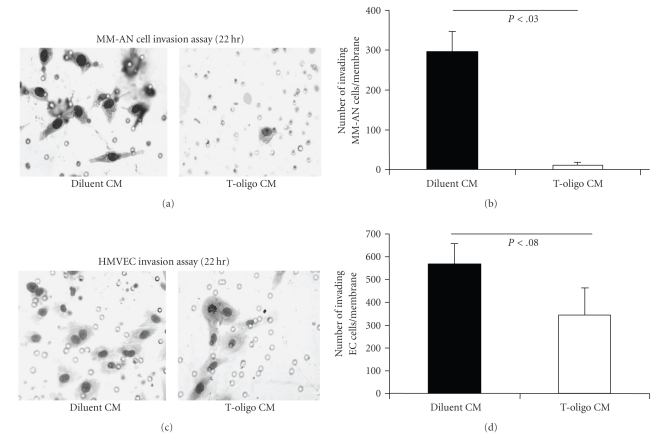
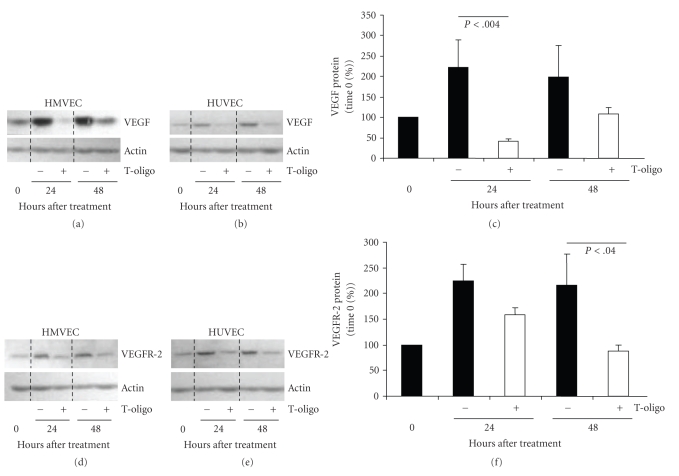
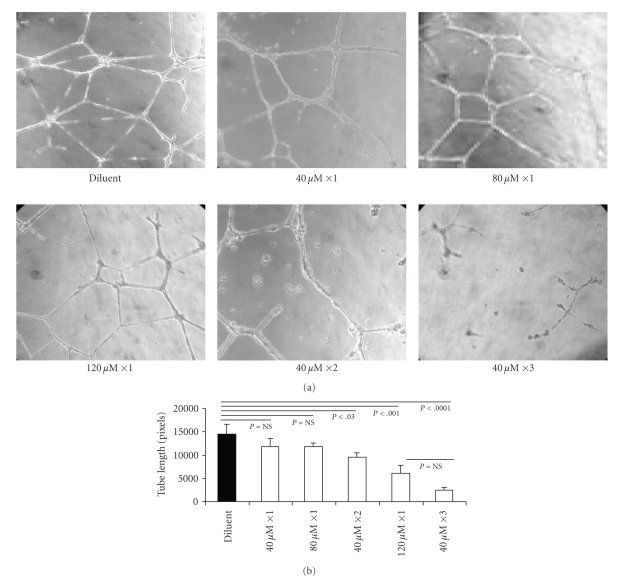
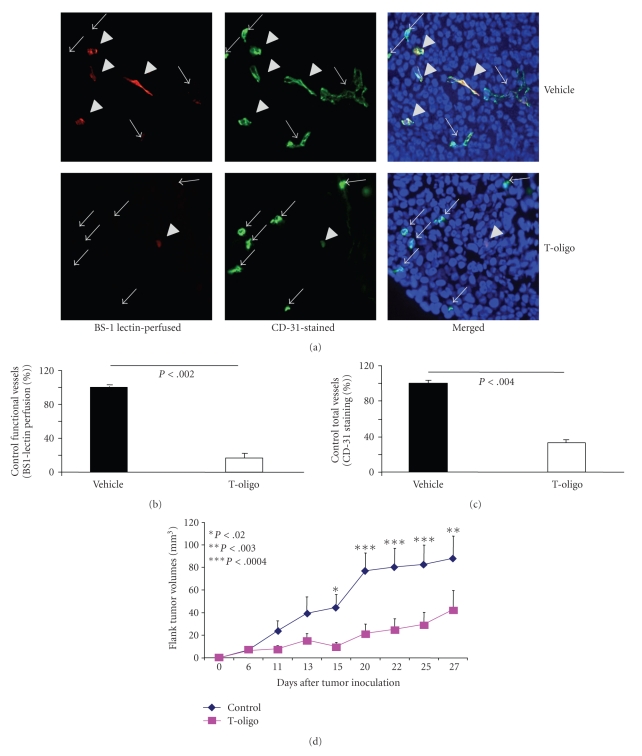
Telomere homolog oligonucleotides (T-oligos) activate an innate telomere-based program that leads to multiple anticancer effects. T-oligos act at telomeres to initiate signaling through the Werner protein and ATM kinase. We wanted to determine if T-oligos have antiangiogenic effects. We found that T-oligo-treated human melanoma (MM-AN) cells had decreased expression of vascular endothelial growth factor (VEGF), VEGF receptor 2, angiopoeitin-1 and -2 and decreased VEGF secretion. T-oligos activated the transcription factor E2F1 and inhibited the activity of the angiogenic transcription factor, HIF-1alpha. T-oligos inhibited EC tubulogenesis and total tumor microvascular density matrix invasion by MM-AN cells and ECs in vitro. In melanoma SCID xenografts, two systemic T-oligo injections decreased by 60% (P < .004) total tumor microvascular density and the functional vessels density by 80% (P < .002). These findings suggest that restriction of tumor angiogenesis is among the host's innate telomere-based anticancer responses and provide further evidence that T-oligos may offer a powerful new approach for melanoma treatment.


Figures

Figure 1
Figure 1
T-oligo treatment down-regulates expression of VEGF, Ang-1, Ang-2 and decreases VEGF production in MM-AN cells. MM-AN cells were treated once at time 0 with either 40 μM T-oligo or diluent alone. (a) Western blot analysis of VEGF protein level. (b) Densitometric analysis of VEGF protein levels (after loading adjustment against actin expression) represented as a percent of time 0 level. Graphs represent pooled data (mean ± SEM) from three independent experiments. (c) and (d) Quantitative real time-PCR (qRT-PCR) of MM-AN cells treated with either 40 μM T-oligo or diluent alone. Results are presented as percent of time 0 (set at 100%) and examined over 48 hours for both control and T-oligo-treated cells. ANG-1 gene expression. (c) ANG-2 gene expression. (d) These experiments are repeated twice with similar results. (e) MM-AN cells were treated with 40 μM T-oligo or diluent alone. The culture medium was collected after 24, 48, and 72 hours. Cumulative VEGF protein released into the medium was measured by ELISA. Results represent data pooled from triplicate dishes for each time point and treatment condition. Changes over time are calculated as percent of the 24 hours values (set at 100%).
Figure 2
Figure 2
T-oligo treatment increases E2F1 expression/activity and decreases HIF-1α DNA binding activity in MM-AN cells. Cells were treated with 40 μM T-oligo or diluent alone and harvested at various times. (a) The pellets were examined by qRT-PCR for E2F1 mRNA level, shown as a percent of time 0 levels (mean ± SEM) for 2 separate experiments in triplicate. (b) The pellets were also examined by western blot analysis for E2F1 protein levels. Actin expression was used as an internal loading control. (c) Densitometric analysis of E2F1 protein expression after loading adjustment by actin, represented as a percent of time 0 levels. Results are pooled data (mean ± SEM) from three independent experiments. (d) The DNA binding activity of E2F1 was analyzed by EMSA. No difference in E2F1 DNA binding activity was detected between the treatment groups at 16 hours (lane 1 versus 2) but E2F1 DNA binding activity doubled in T-oligo treated cells at 32 hours (lane 3 versus 4). Specificity of bands was confirmed by preincubating the nuclear protein of T-oligo-treated cells harvested at 32 hours with ×25 cold probe (lane 4 versus 5) and by supershift of E2F1 protein/DNA and E2F1 competing antibody complex (lane 4 versus 6). (e) Quantification of the band intensity of DNA binding activity is represented as relative density untis (RDU) for both treatment groups at 16 and 32 hours after treatment. E2F1 EMSA was repeated 2 times with similar results. (f) Nuclear protein was isolated from cells and processed for electromobility shift assay (EMSA) for evaluation of HIF-1α DNA binding activity. Specificity of the bands was confirmed by preincubating the nuclear protein extract of cells treated with diluent for 32 hours with ×25 cold probe (not labelled with 32P) and mutant HIF-1α consensus sequence for 20 minutes before incubating the nuclear extracts with 32P-labeled consensus oligonucleotides. HIF-1α EMSA was repeated 2 times with similar results. (g) Densitometric analysis of the protein/DNA complex bands for HIF-1α is graphed as relative densitometric units (RDU).
Figure 3
Figure 3
T-oligo treatment inhibits Matrigel invasion by MM-AN cells and HMVECs. MM-AN cells were treated with 40 μM T-oligo or diluent alone. The culture medium was collected after 72 hours. The conditioned medium harvested after 72 hours was used as the chemoattractant for the invasion assay for MM-AN and HMVECs. MM-AN cells were plated on the inserts and allowed 22 hours to move through the pores on the membrane in the bottom of the inserts toward the medium in the lower chamber, interpreted as invasion of the gel. The experimental inserts had a layer of Matrigel, whereas control inserts (not shown) did not. After 22 hours cells that moved through the pores in the membrane were fixed, stained and photographed. (a) Representative images for MM-AN cells are shown. Small open circles are the pores in the membrane, not cells. (b) The total number of cells was counted for 3 membranes for each treatment condition and graphed as a number of cells (mean ± SEM) for both treatment groups. The assay was repeated twice with identical results. (c) Representative images for HMVECs treated as described for MM-AN above are shown. Small open circles are the pores in the membrane, not cells. (d) The total number of HMVECs were counted for 3 membranes for each treatment condition and graphed as an average number of cells for each treatment group (mean ± SD). The assay was repeated twice with identical results. Reductions approached but did not reach statistical significance.
Figure 4
Figure 4
T-oligo decreases VEGF and VEGFR-2 protein levels in normal endothelial cells. HMVEC and HUVEC were treated with 40 μM T-oligo or diluent alone and harvested for western blot analysis over 48 hours. (a) VEGF protein expression in HMVEC. Here and elsewhere actin expression was used to adjust the loading. (b) VEGF protein expression in HUVEC. (c) Combined densitometric analysis of VEGF expression in HMVEC and HUVEC as a percent of time 0 levels, after loading adjustment. (d) VEGFR-2 protein expression in HMVEC. (e) VEGFR-2 protein expression and HUVEC, and (f) Combined densitometric analysis, as in (c).
Figure 5
Figure 5
T-oligo treatment inhibits EC tubulogenesis in vitro. HMVEC cells were plated on Matrigel in four-well chamber slides and treated in triplicate with T-oligo or diluent alone, as described in the text. (a) All representative images are taken 22 hours after plating cells into chambers, the time of biggest differences among treatment conditions. (b) The length of tube-like structures was quantified as total average tube lengths per visual field from 3 separate chambers for each treatment condition. The differences in the length of tube-like structures were quantified (in pixels) in at least 3–5 representative photographs per chamber/treatment condition using computer-assisted image analysis.
Figure 6
Figure 6
T-oligo decrease tumor angiogenesis and melanoma tumor volumes in mouse SCID xenografts. (a) Representative images of 6 μm tumor cross-sections immunostained with CD31 (green) and TopRo-3 (blue-nuclei) and perfused in vivo with BS-1 lectin (red), to determine tumor microvascular density (MVD) per high power field (HPF) ×40 magnification. Both functional and total vessels were examined in 5 mice/group. Arrows indicate CD31 (+) vessels that are considered nonfunctional (not perfused) whereas arrowheads indicate double (+) BS-1 lectin/CD31 vessels that are considered functional (perfused in vivo). (b) Percent functional vessels (red-BS-1 lectin staining) in T-oligo injected mice, taking MVD in vehicle injected mice as 100%. (c) Percent total vessels (green-CD31 staining) in T-oligo injected mice, taking MVD in vehicle injected mice as 100%. (d) SCID mice were injected with MMAN cells into the flank. T-oligo or vehicle was injected daily for up to 5 days when tumors were first palpable (2-3 mm diameter). Average tumor volume/animal was recorded over 4-weeks in 5-6 mice/group.
Figure 7
Figure 7
Evaluation of T-oligos toxicity in internal organs of SCID mice 24 hours after the last IV injection (15 mg/kg BID for 5 days). (a) Bone marrow, displaying a mixture of myeloid and erythroid precursor cells as well as plasma cells. Scattered megakeryocytes are also present. There is no evidence of bone marrow suppression or toxicity. (b) Liver lobule with a central vein surrounded by hepatocytes. The cells display a fixation artifact but otherwise appear normal. There is no evidence of cellular necrosis or apoptosis. (c) Jejunal mucosa displaying normal arrangement of villi lined by tall columnar cells. Both the mucosa and the submucosa appear normal. Fragments of normal pancreatic acinar tissue are seen in the bottom left of the image. (d) Section of the brain showing normal brain architecture with typical neuronal ganglia and scattered small dark glial cells in a pink neuropil background. (e) Normal lung tissue displaying multiple alveoli as well as bronchioles lined with cuboidal epithelial lining. (f) The kidney displays two normal glomeruli that are surrounded by tubules with cuboidal epithelium.

Similar articles

Cited by

References

    1. Folkman J. Angiogenesis. Annual Review of Medicine. 2006;57:1–18. - PubMed
    1. Weidner N. New paradigm for vessel intravasation by tumor cells. American Journal of Pathology. 2002;160(6):1937–1939. - PMC - PubMed
    1. Chen C-H, Jiang W, Via DP, et al. Oxidized low-density lipoproteins inhibit endothelial cell proliferation by suppressing basic fibroblast growth factor expression. Circulation. 2000;101(2):171–177. - PubMed
    1. Bradbury D, Clarke D, Seedhouse C, Corbettt L, Stocks J, Knox A. Vascular endothelial growth factor induction by prostaglandin E2 in human airway smooth muscle cells is mediated by E prostanoid EP 2/EP4 receptors and SP-1 transcription factor binding sites. Journal of Biological Chemistry. 2005;280(34):29993–30000. - PubMed
    1. Pagès G, Pouysségur J. Transcriptional regulation of the Vascular Endothelial Growth Factor gene—a concert of activating factors. Cardiovascular Research. 2005;65(3):564–573. - PubMed